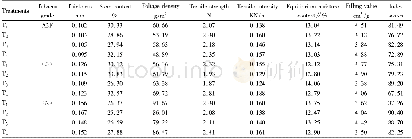
《Table 3 Texture properties of catalysts with different P contents》
It can be seen from Table 3 that impregnation amount of phosphoric acid does not have a linear relationship with specific surface area,pore volume and pore size of the catalyst.Specific surface area of the catalyst gradually decreases as the amount of phosphorus increases.When phosphorus was not injected,specific surface area of the catalyst reached a maximum value of305.5 m2·g-1.When phosphorus is loaded,specific surface area of the catalyst is smaller.Further,as the amount of phosphorus increases,pore diameter of the catalyst gradually increases.This is because the change of specific surface area of the catalyst causes change of pore diameter.The larger the specific surface area of the catalyst is,the smaller the pore diameter is.
| 图表编号 | XD0032610700 严禁用于非法目的 |
|---|---|
| 绘制时间 | 2019.01.15 |
| 作者 | 黄蕾、汤颖、张莉、高雄厚 |
| 绘制单位 | 西安石油大学化学化工学院、中国石油兰州化工研究中心、西安石油大学化学化工学院、中国石油兰州化工研究中心、中国石油兰州化工研究中心 |
| 更多格式 | 高清、无水印(增值服务) |
 提示:宽带有限、当前游客访问压缩模式


