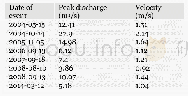
《Table 2 Visibility levels corresponding to ranges and estimated values of visibility distances》
 提示:宽带有限、当前游客访问压缩模式
本系列图表出处文件名:随高清版一同展现
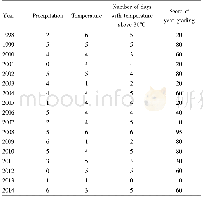
《湖北省标准化霾天气统计数据集(1961-2013)》
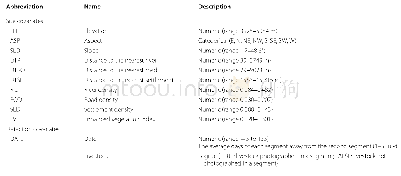
where x is the random value of the raw sequence;xmax is the maximum of the raw sequence;xmin is the minimum of the raw sequence;x'is the standardized random value of the rawsequence.The standardized process of visibility calculated as10-Vi.The division grades of LSCHI are shown in Table 3.
| 图表编号 | XD0027632600 严禁用于非法目的 |
|---|---|
| 绘制时间 | 2018.03.25 |
| 作者 | 王凯、周月华、方思达、张丽文 |
| 绘制单位 | 武汉区域气候中心、武汉区域气候中心、武汉区域气候中心、武汉区域气候中心 |
| 更多格式 | 高清、无水印(增值服务) |

