《Table 3 The statistics on solar power generation potential and economic indicators》
 提示:宽带有限、当前游客访问压缩模式
本系列图表出处文件名:随高清版一同展现
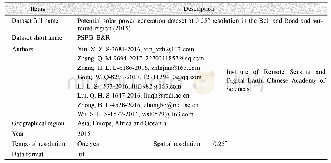
《“一带一路”及其毗邻区域0.25°分辨率太阳能发电潜力数据集(2015)》
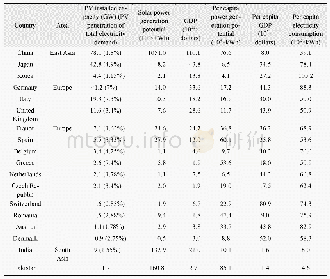
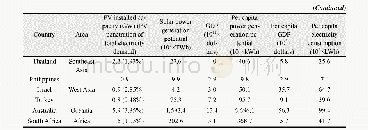
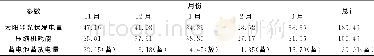
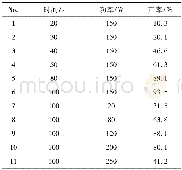
Based on the solar power generation potential in the Belt and Road and surround Regions(Figure 2),the total and per capita solar power generation potentials in countries were calculated as shown in Table 3.Australia has the highest total solar power potential,1.59×106 TWh,followed by China with 1.05×10⁶ TWh.China’s newly added and accumulated photovoltaic installed capacities in 2016 are the highest in the world at 35.5 GW and 78.1 GW,respectively.
| 图表编号 | XD0027625700 严禁用于非法目的 |
|---|---|
| 绘制时间 | 2017.12.25 |
| 作者 | 辛晓洲、张乾、张海龙、龚围、李丽、柳钦火、仲波、吴善龙 |
| 绘制单位 | 中国科学院遥感与数字地球研究所遥感科学国家重点实验室、中国科学院遥感与数字地球研究所遥感科学国家重点实验室、中国科学院大学、中国科学院遥感与数字地球研究所遥感科学国家重点实验室、中国科学院遥感与数字地球研究所遥感科学国家重点实验室、重庆师范大学、中国科学院遥感与数字地球研究所遥感科学国家重点实验室、中国科学院遥感与数字地球研究所遥感科学国家重点实验室、中国科学院遥感与数字地球研究所遥感科学国家重点实验室、中国科学院遥感与数字地球研究所遥感科学国家重点实验室、重庆邮电大学 |
| 更多格式 | 高清、无水印(增值服务) |