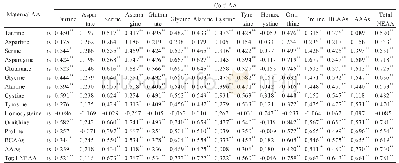
《Table 3 Correlations between carbon stocks and climatic variables at nine sampling sites》
 提示:宽带有限、当前游客访问压缩模式
本系列图表出处文件名:随高清版一同展现
《Altitude pattern of carbon stocks in desert grasslands of an arid land region》
Note:*Significant at P≤0.05;**significant at P≤0.01.AGB,aboveground biomass;BGB,belowground biomass;LFB,litterfall biomass;MAT,mean annual temperature;MAP,mean annual precipitation.
Although soil-C stock tended to decrease with MAT,we identified no significant correlations between biomass-C stocks and MAT.The AGB-C stock increased with increasing MAP(Table 3).In addition,a better fit was obtained between soil-and biomass-C stocks and MAP.
| 图表编号 | XD0023782500 严禁用于非法目的 |
|---|---|
| 绘制时间 | 2018.10.01 |
| 作者 | Rong Yang、JunQia Kong、ZeYu Du、YongZhong Su |
| 绘制单位 | Linze Inland River Basin Research Station, Key Laboratory of Ecohydrology of Inland River Basin, Northwest Institute of Eco-Environment and Resources, Chinese Academy of Sciences、Linze Inland River Basin Research Station, Key Laboratory of Ecohydrology of |
| 更多格式 | 高清、无水印(增值服务) |
查看“Table 3 Correlations between carbon stocks and climatic variables at nine sampling sites”的人还看了
-

- Table 3 Associations between the frequency of carbonated beverages consumption and carotid atherosclerosis1
-

- Table 3 Correlations between brain-derived neurotrophic factor level and clinical and experimental parameters in all sub


