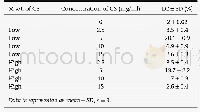
《Table 4–The effect of selected CS molecular weight and concentration on surface porosity%for plain
 提示:宽带有限、当前游客访问压缩模式
本系列图表出处文件名:随高清版一同展现
《Novel technique of insulin loading into porous carriers for oral delivery》
CS coated PLGA formulae were visualized using SEM.SEM micrographs(Fig.1 B–D)show the deposition of CS onto the surface of PLGA MPs at different CS concentrations compared to uncoated ones.SEM images reveal the disappearance of surface pores with the deposition of CS coating.By visual inspection and surface porosity data(Fig.1 E),it can be noted that the number of surface pores was inversely related to the CS concentration.Hence,CS concentration of5 mg/ml showed the most efficient blocking(surface porosity decreased from 15%±6%to 1.3%±0.02%,P<0.001)compared to the higher concentrations 10 and 15 mg/ml(surface porosity was 2.9%±1.3%and 6.6%±4%respectively,P<0.001,Table 4).These findings confirm the reason for the highest LC%achieved with 5 mg/ml where the polymer diffusion into the pores towards the surface reached its maximum.
| 图表编号 | XD00186268000 严禁用于非法目的 |
|---|---|
| 绘制时间 | 2018.07.01 |
| 作者 | Sarah Y.Eilleia、Mahmoud E.Soliman、Samar Mansour、Ahmed.S.Geneidi |
| 绘制单位 | Department of Pharmaceutics and Industrial Pharmacy, Faculty of Pharmacy,Ain Shams University、Department of Pharmaceutics and Industrial Pharmacy, Faculty of Pharmacy,Ain Shams University、Department of Pharmaceutics and Industrial Pharmacy, Faculty of Pha |
| 更多格式 | 高清、无水印(增值服务) |
查看“Table 4–The effect of selected CS molecular weight and concentration on surface porosity%for plain PLGA MPs using double”的人还看了
-

- Table 2–The effect of CS molecular weight and concentration on insulin LC%from PLGA MPs using double freezedrying techni
-

- Table 2 Effect of Na Cl stress on the selectivity SK, Na, SCa, Na of ion absorption and transport of A.officinalis seedl
-

- Table 3 The size, molecular weight, theoretical isoelectric point and hydrophobicity of the six unknown proteins


