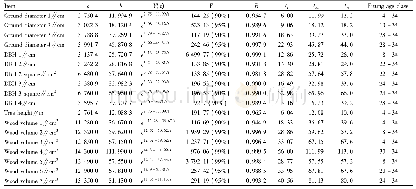
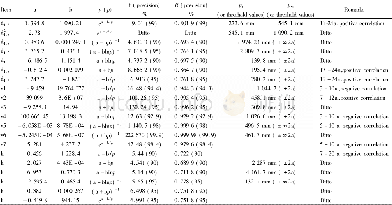
《Table 1 Empirical fitting equations for tree growth process》
 提示:宽带有限、当前游客访问压缩模式
本系列图表出处文件名:随高清版一同展现
《Discussion on Individual Expected Maturity Age of Populus tomentosa Carr》
A linear equation was obtained by taking the logarithm of the tree growth equations,which was then used to get the values of parameters a,b.The F-test and correlation coefficient R test of the2 parameters were performed[2].Through the tests,the tree growth fitting equations was established(Table 1).As shown in Table 1,in addition to the fitting equations of tree height and wood value 1,which passed the F-test with the reliability of 90%,the fitting equations for DBH 1 and its square,tree height,wood volume 2 and wood volume 3 all passed the F-test with the reliability over 95%,and the fitting equations for others passed the F-test and R-test with the reliability over 99%,indicating that this mathematical model(the empirical fitting equation)was applicable as a whole.All passed the correlation coefficient R test with reliability of 99.9%,suggesting that the fitting equation relationship was established.The maximum time of current annual increment and numerical maturity age of trees by the fitting equations were illustrated with ground diameter 1 as an example.For the equation of average growth rate of trees(current annual increment was completed by the derivation of the function Y (t)in Table 1,and only the extreme point was given in the paper) ,the extreme point tz=8.05a,that is,the current annual increment reached the peak when the tree reached 8 years old,and the peak was a single one.For the equation of numerical maturity age of trees(annual average increment,and only the extreme point was given in the paper),the extreme point tm=16.11 a,so the numerical maturity age of the trees was 16.11 a.In this paper,only the fitting equations for ground diameter were stated,and all other fitting equations were done in the same way.The meanings were all the same for growth fitting equation,tree growth rate equation,tree average growth speed equation,so were the significances of symbols of tz,tm,so the calculation results were given indirectly in the paper.The numerical maturity ages of each item were shown in Table 1.As shown in Table 1,the squares of the indexes were doubled compared with the indexes,but the accuracies were equal to the F-test values and R-test values.This was caused by the exponential mathematical relationship.In order to compare with the accumulation fitting equation,a fitting equation of DBH square was deliberately established.In Table 1,the values of tnwere the ages at the points of intersections of the curves of current annual increments and annual average increments of the sample wood(the values of wood volume 3 were obtained using the tendency chart of growth curves),which could be used as the actual maturity ages of the tree wood.In addition to DBH 1,DBH 2,which showed great differences from their squares tmand tn,all other were very close to the values of tn.Therefore,it was more suitable to fit the wood volumes using empirical equations.The research results had high reliability.In this paper,the maturity of trees was considered according to the maturity of tree volume.Thus,based on the research results and the needs for production practice,it was more suitable to set the maturity age of accumulation volume as the maturity age of the tree.The fitting results of wood volumes from the calculation of empirical equations were consistent with the fitting results obtained from the parse wood analysis,thereby indicating that the accuracy and applicability of the test were reliable[3].
| 图表编号 | XD00183081500 严禁用于非法目的 |
|---|---|
| 绘制时间 | 2018.08.01 |
| 作者 | Changgang WANG、Xuanwei MA、Ailing Li、Jinzhi ZHANG |
| 绘制单位 | Whedon Sub-center of Weihai Real Estate Registration Centre、Yanzhou Forestry Technology Extension Center of Jining City、Junan County Forestry Bureau、Forestry Survey and Planning Institute of Shandong Province |
| 更多格式 | 高清、无水印(增值服务) |


