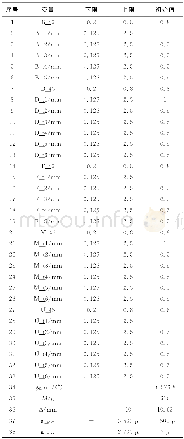
《Table 2 Initial values of primary data of major traits of the tested varieties》
 提示:宽带有限、当前游客访问压缩模式
本系列图表出处文件名:随高清版一同展现
《Application of Grey Correlation Degree Analysis in Broad Bean Strain Screening》
The dimensions of each trait data are different,so the values of the traits in the same cultivar are quite different.According to the principles of comparability and accessibility,the original data in Table 1 were processed in terms of dimensions.Assume that the yield per plant was the reference data array Yij,and the major traits of plant height,effective length of podding branches,branch number per plant,pod number per plant,grain number per pod and100-grain weight were Xi(1),Xi(2),Xi(3),Xi(4),Xi(5)and Xi(6).According to the formula Yij=Yij(k)/Yij(l),Xi(k)=Xij(k)/Xij,the original data of the various traits were initialized(Table 2).
| 图表编号 | XD00183025900 严禁用于非法目的 |
|---|---|
| 绘制时间 | 2018.06.01 |
| 作者 | Lin ZENG、Chunqin WU、Guotian YANG、Chaozhong ZHANG、Shunsheng LU、Yunfei SONG、Yan LIU、Lamei YANG、Guixian WU |
| 绘制单位 | Longyang Agricultural Technique Extension Station of Baoshan City、Longyang Soils and Fertilizers Workstation、Longyang Agricultural Technique Extension Station of Baoshan City、Longyang Agricultural Technique Extension Station of Baoshan City、Longyang Agric |
| 更多格式 | 高清、无水印(增值服务) |


