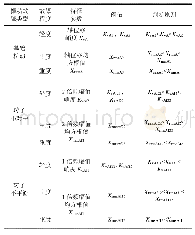
《Table 3 Fault geometric model of 1 (row) *3 (column)》
 提示:宽带有限、当前游客访问压缩模式
本系列图表出处文件名:随高清版一同展现
《Fault geometrical model of Dujiangyan section in Longmenshan fault zone》
Note:Model A13 is equal to the length and width of each subfault.Model B13 is equal in width to each subfault,but the lengths are not equal.Each subfault is arranged from south to north.
In this paper,the entire fault plane was divided into model A11 according to 1(row)×1(column)(the schematic diagram of the fault plane is shown in Figure 3) .The parameters are shown in Table 2.The plane fault dip angle that calculated from equations(1)–(7)is 45.1°.In order to verify the correctness of fault dip results,we used 10 GPSobservations such as points H050,H049,PIXI,Z246,etc.We used the Repulsive Particle Swarm(RPS)algorithm combined with finite rectangular dislocation model to invert the slip of the fault(Okada,1985;Mishra,2006),because of the shear fracture of the fault,the crushing or tensile components of the fault are not considered.The inversion results are shown in columns 6 and 7 of Table 2,and the forward surface displacements(see black arrows in Figure 5)are based on the inversion results.The near-field point H050(blue arrows)by model calculations has a good fit to GPS observations.Compared with GPS observations,the calculated values of the model are not only smaller in size but also different in direction at the point Z246 and the point PIXI.However,there is a significant difference between the calculated value of the point H049 and the GPS observation value.Although the directions are basically the same,The size is obviously different,indicatingthat the fault movement has inhomogeneity and needs to subdivide the fault along the length of the fault plane.
| 图表编号 | XD0017181200 严禁用于非法目的 |
|---|---|
| 绘制时间 | 2018.06.01 |
| 作者 | Hu-Rong Duan、Sheng-Lei Chen、Run Li、Quan-Chao Yan |
| 绘制单位 | College of Geomatics, Xi'an University of Science and Technology、College of Geomatics, Xi'an University of Science and Technology、College of Geomatics, Xi'an University of Science and Technology、College of Geomatics, Xi'an University of Science and Te |
| 更多格式 | 高清、无水印(增值服务) |


