《表3 2005—2015年中原城市群显著城市统计Tab.3 Statistics of significant city in Zhongyuan Urban Agglomeration from
 提示:宽带有限、当前游客访问压缩模式
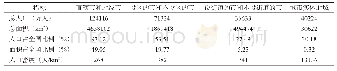
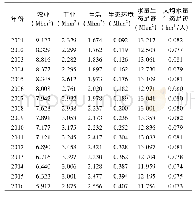
为了清晰地反映中原城市群经济空间差异的具体过程,分别计算2005—2015年每年中原城市群各城市人均GDP的Local Moran’s I,将显著(p<0.05)的城市按照HH区、HL区、LL区、LH区进行统计(表3),并将2005,2008,2012和2015年人均GDP排名前10位的城市汇总比较(表4)。
| 图表编号 | XD0016804600 严禁用于非法目的 |
|---|---|
| 绘制时间 | 2018.12.10 |
| 作者 | 王元亮 |
| 绘制单位 | 河南省社会科学院科研处 |
| 更多格式 | 高清、无水印(增值服务) |

