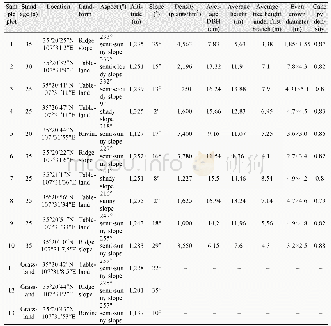
《Table 3 The information of the sample plots》
 提示:宽带有限、当前游客访问压缩模式
本系列图表出处文件名:随高清版一同展现
《陇东黄土高原区人工刺槐林树干液流数据集(2017–2019)》
On the premise of preliminary investigation in May 2017,standard plots(20 m×20 m)were set up in typical sections of small watershed to investigate the stands(Table 2).It was found that the density of 25-year artificial Robinia pseudoacacia with 750 trees·hm–2 of stand density,and the average height of trees was 14.88 m,the average DBH was 16.81 cm,and the canopy density was 0.8.Considering the influence of the cable length on the monitoring results,8 standard trees with good growth of different diameter grades,straight and complete trunk and moderate crown are selected as the sample trees in the relatively concentrated areas in the sample plots(Table 3).
| 图表编号 | XD00153333300 严禁用于非法目的 |
|---|---|
| 绘制时间 | 2020.03.25 |
| 作者 | 张军、邸利、陈徵尼、王安民、倪帆、任艺彬、费俊娥、吴贤忠、王正安、韩芬、汝海丽、景贯阳 |
| 绘制单位 | 甘肃农业大学资源与环境学院、甘肃农业大学资源与环境学院、甘肃省林业科学研究院、平凉市水土保持科学研究所、甘肃农业大学资源与环境学院、陇东学院农林科技学院、甘肃农业大学资源与环境学院、兰州城市学院、宁夏农林科学院固原分院、平凉市水土保持科学研究所、平凉市水土保持科学研究所、甘肃农业大学资源与环境学院 |
| 更多格式 | 高清、无水印(增值服务) |


