《表1 生产的最佳平均功率Tab.1The best average power for production》
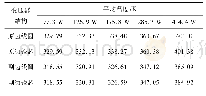
为了评估SCPD算法在解决目标函数的最优解比较,使用IPM方法找到最优解,对于给定的要求和允许的最大供应在t=1时进行先验,所得到的平均产生的功率如表1所示,这些值大多与图2中的值和图4中的平均功率一致。最优成本与并网模式之间的性能差距小于0.1%。验证了实验结果与所提出的协作型电力调度算法的合理性。
图表编号 | XD0014823900 严禁用于非法目的 |
---|---|
绘制时间 | 2018.06.25 |
作者 | 李津、蒋晨达 |
绘制单位 | 福建水利电力职业技术学院、福建水利电力职业技术学院 |
更多格式 | 高清、无水印(增值服务) |
查看“表1 生产的最佳平均功率Tab.1The best average power for production”的人还看了
- 表3 传输功率对松耦合变压器平均温度影响Tab.3 Effect of transmission power on average temperature of loosely coupled transformer
- 表1 东北地区主要道地中药材产销状况Tab.1The production and marketing status of traditional Chinese medicine herbs in northeast China
- 表1 左右两侧海绵窦各三角平均面积 (n=12, mm2) Tab.1The average triangle area of the cavernous sinus on the left and right sides (n=12, m