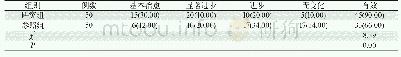
《表3 两组患者的治疗效果对比 (n, %) Table 3 Comparison of treatment effects between the two groups (n, %)》
 提示:宽带有限、当前游客访问压缩模式
研究组的临床疗效显著优于对照组(P<0.05),详见表3。
| 图表编号 | XD0012924800 严禁用于非法目的 |
|---|---|
| 绘制时间 | 2018.08.01 |
| 作者 | 黄震、印春涛、陈望、姚选军、钱斌 |
| 绘制单位 | 盐城市第一人民医院影像科、盐城市第一人民医院影像科、盐城市第一人民医院影像科、南京医科大学附属无锡人民医院医学影像科、南京医科大学附属无锡人民医院医学影像科 |
| 更多格式 | 高清、无水印(增值服务) |
![表2 实验组与对照组患者的治疗有效率对比[例 (%) ]Tab 2 comparison of the effective rate of treatment between the experimental group and the c](http://bookimg.mtoou.info/tubiao/gif/YPPJ201901003_05600.gif)

![表1 两组患者临床治疗效果比较[n, (%) ]Tab.1 Comparison of clinical treatment effects between two group patients[n, (%) ]](http://bookimg.mtoou.info/tubiao/gif/HELJ201818011_03500.gif)