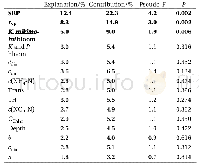
《Table 4–Top 10 candidate crosses selected by usefulness of selection index.》
 提示:宽带有限、当前游客访问压缩模式
本系列图表出处文件名:随高清版一同展现
《Use of genomic selection and breeding simulation in cross prediction for improvement of yield and quality in wheat(Triticum aestivum L.)》
EXT,extensibility;MR,maximum resistance;P1,parent 1;P2,parent 2;RILs was selected using a proportion of 0.05,and used in calculating the progeny mean;MP,midparent GEBV.aProgeny means over midparent GEBVs.
Trait correlations changed from parental to progeny populations.As an example,Fig.7 shows distribution of correlations between two quality traits and yield.In the training population,the correlation was-0.02 between MR and yield,and-0.68 between EXT and yield(Table 2).However,the correlations ranged from-0.61 to 0.63 for MR(Fig.7-A)with a mean of-0.008,and from-0.88 to 0.27 for EXT(Fig.7-B)with a mean of-0.51.Thus,even though a quality trait showed a strong negative correlation with yield in training population,it was still possible to see a positive correlation in the progeny population derived from two parents selected from the training population.
| 图表编号 | XD0012326500 严禁用于非法目的 |
|---|---|
| 绘制时间 | 2018.08.01 |
| 作者 | Ji Yao、Dehui Zhao、Xinmin Chen、Yong Zhang、Jiankang Wang |
| 绘制单位 | The National Key Facility for Crop Gene Resources and Genetic Improvement, National Wheat Improvement Center, Institute of Crop Sciences,Academy of Agricultural Sciences、The National Key Facility for Crop Gene Resources and Genetic Improvement, National W |
| 更多格式 | 高清、无水印(增值服务) |
查看“Table 4–Top 10 candidate crosses selected by usefulness of selection index.”的人还看了
-

- Table 1 The top candidate co-occurrence occupancy models(ΔAIC<2)used to evaluate the effect of environmental variables a


