《Table 2–Zn concentration in different parts of the rice kernel as influenced by variety and Zn fert
 提示:宽带有限、当前游客访问压缩模式
本系列图表出处文件名:随高清版一同展现
《Zinc partitioning in basmati rice varieties as influenced by Zn fertilization》
Main effects sharing the same case letter,for a parameter during an experimental year,do not differ significantly(P=0.05)by the LSD test.Likewise,the figures of main effects without lettering do not differ significantly(P=0.05)by the LSD test.Zn0,c
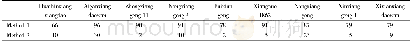
The highest Zn concentrations in straw were found in‘PS 5’,‘PRH 10’,and‘PB 1401’(Table 1).In general,Zn concentration was lower during initial crop growth stages and subsequently increased.Of the six rice varieties studied,‘PS 5’showed the highest Zn concentration at 30,60,and 90 days after transplanting(DAT)compared to the others.On average,at60 DAT all rice varieties showed~54%higher Zn concentration than at 30 DAT,and at 90 DAT showed 132%higher Zn content than at 60 DAT.Among the kernel parts,the hull showed the highest Zn concentration followed by bran and white rice kernel(Table 2).In both years,‘PB 1509’showed the highest Zn concentration in the hull(75.63 and 73.90 mg kg-1),bran(50.20 and 48.74 mg kg-1)and rice kernel(13.95 and13.96 mg kg-1),as reflected in maximum Zn mobilization efficiency(0.40 and 0.38).‘PB 1121’,‘PB 1460’,and‘PRH 10’showed moderate Zn content in hull,bran,and white rice kernel.These varieties also showed lower Zn HI and Zn MEI,leading to the lowest Zn concentrations.However,irrespective of source,Zn applications did not increase Zn concentration in rice plants at 30 DAT.On average,Zn4treatment resulted in significantly higher Zn concentrations at 60 and90 DAT,followed by Zn2.Zn fertilization effects were clearly visible when plots supplied with treatments Zn4and Zn2showed highest Zn concentrations in straw,hull,rice bran,and white rice kernel(Table 2).On an average,hulls had 50.4%Zn concentration and bran 38.1%,while white rice kernel had only 11.5%of the total Zn concentration in rice seed.Zn concentration decreased in the order hull>bran>white rice kernel(Table 2).
| 图表编号 | XD0012316300 严禁用于非法目的 |
|---|---|
| 绘制时间 | 2018.04.01 |
| 作者 | Prakash Chand Ghasal、Yashbir Singh Shivay、Vijay Pooniya、Mukesh Choudhary、Rakesh Kumar Verma |
| 绘制单位 | ICAR—Indian Agricultural Research Institute、ICAR—Indian Agricultural Research Institute、ICAR—Indian Agricultural Research Institute、ICAR—Indian Agricultural Research Institute、ICAR—Indian Agricultural Research Institute |
| 更多格式 | 高清、无水印(增值服务) |


