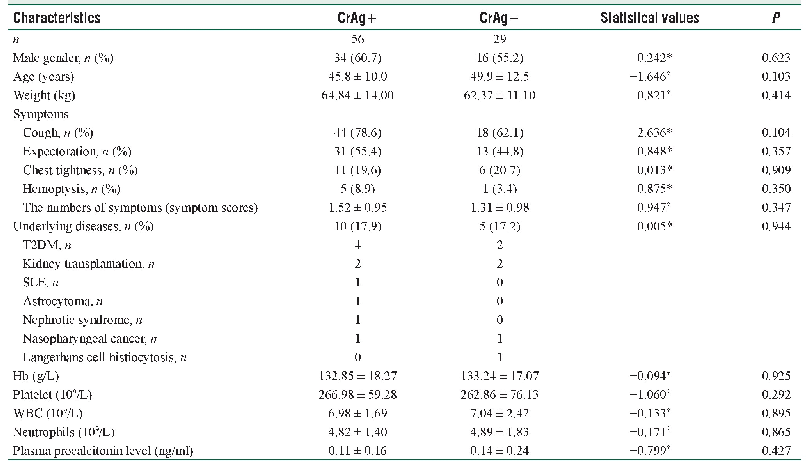
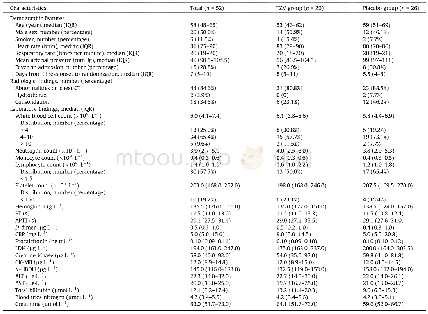
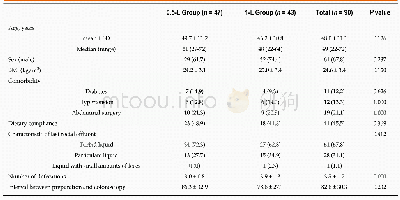
《Table 1 Characteristics of the patients at baseline》
 提示:宽带有限、当前游客访问压缩模式
本系列图表出处文件名:随高清版一同展现
《Role of D2 gastrectomy in gastric cancer with clinical para-aortic lymph node metastasis》
Violin plots of the distribution of the short axis diameter of the largest PAN distributed by whether the patient underwent D2 resection or not are shown in Figure2A(baseline)and Figure 2C(after initial chemotherapy).Violin plots of the distribution of the short axis diameter of the largest PAN distributed by whether more than 2 PAN stations were involved or not are shown in Figure 2B(baseline)and Figure 2D(after initial chemotherapy).The distributions in both treatment groups and PAN stations significantly varied at baseline(chemotherapy vs chemotherapy plus D2gastrectomy,P=0.01,Figure 2A;PAN stations 1-2 vs 3-4,P=0.001,Figure 2B)but were not significantly different after chemotherapy(chemotherapy vs chemotherapy plus D2 gastrectomy,P=0.29,Figure 2C;PAN stations 1-2 vs 3-4,P=0.06,Figure 2D).The correlation between CR of all clinical PALM and clinical characteristics is displayed in Table 4.The largest PAN in the short axis at baseline(≥15 mm vs<15mm),overall response(RECIST),and response of the primary lesion(JGCA)were correlated with CR of PALM.Considering the diameter of the index nodes,a CR was observed in 3 of 12 patients with PAN≥15 mm(25%)and in 10 of 26 patients with PAN≥10 mm(38.5%).
| 图表编号 | XD0064286500 严禁用于非法目的 |
|---|---|
| 绘制时间 | 2019.05.21 |
| 作者 | Xiao-Hao Zheng、Wen Zhang、Lin Yang、Chun-Xia Du、Ning Li、Gu-Sheng Xing、Yan-Tao Tian、Yi-Bin Xie |
| 绘制单位 | Department of Pancreatic and Gastric Surgery,National Cancer Center、National Clinical Research Center for Cancer、Cancer Hospital,Chinese Academy of Medical Sciences and Peking Union Medical College、Department of Medical Oncology, National Cancer Center、Na |
| 更多格式 | 高清、无水印(增值服务) |
查看“Table 1 Characteristics of the patients at baseline”的人还看了
-
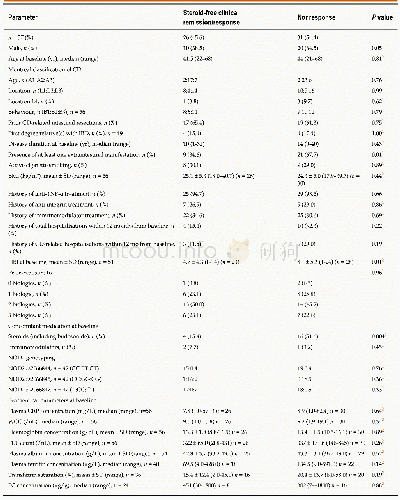
- Table 3 Comparison of baseline characteristics between the subgroups of patients with steroid-free clinical response ver
