《Table 2 Classification statistic of renovation potential》
 提示:宽带有限、当前游客访问压缩模式
本系列图表出处文件名:随高清版一同展现
《Arrangement of High-standard Basic Farmland Construction Based on Village-region Cultivated Land Quality Uniformity》
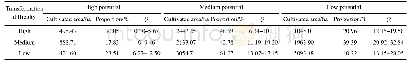
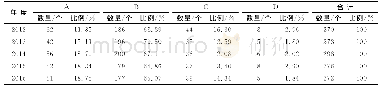
By calculating the comprehensive transformation potential Q of all barrier indexes under each difficulty grade in each administrative village,Q was between 0.30 and19.58 in the high transformation difficulty grade,between 0 and 32.84 in the medium transformation difficulty grade,and between 6.27 and 28.05 in the low transformation difficulty grade.There was significant difference in the administrative villages of the different regions.Using the natural breaks method,the comprehensive transformation potential in these three transformation difficulty grades was divided into three grades:high,medium and low.In the high transformation difficulty level,the comprehensive transformation potential was mainly in the high and medium level with 79.04%of the cultivated land of the study area.In the medium transformation difficulty level,the comprehensive transformation potential was mostly in the medium and low level with 82.17%of the cultivated land area.In the low transformation difficulty level,the comprehensive transformation potential was mainly in the high and medium level with 89.78%of cultivated land area.By comparing the ranges Q in these three transformation difficulty grades,it could be found that the comprehensive restriction of indexes under these three potential levels in the medium and low transformation difficulty grades was higher than the restriction in the high transformation difficulty transformation grade.This shows that indexes that were difficult to transform were less restrictive to CLQ,and the feasibility of improving CLQ in the project area was strong(Table 2).
| 图表编号 | XD0046963600 严禁用于非法目的 |
|---|---|
| 绘制时间 | 2019.04.01 |
| 作者 | SONG Wen、WU Kening、ZHAO Huafu、ZHAO Rui、LI Ting |
| 绘制单位 | School of Land Science and Technology, China University of Geosciences、Key Laboratory of Land Consolidation and Rehabilitation, Ministry of Land and Resources、School of Land Science and Technology, China University of Geosciences、Key Laboratory of Land Co |
| 更多格式 | 高清、无水印(增值服务) |