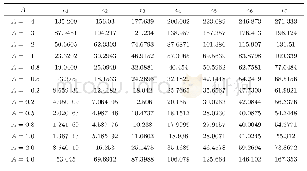
《Table 3 ROC curves of potential biomarker levels for differentiating control group from infantile H
 提示:宽带有限、当前游客访问压缩模式
本系列图表出处文件名:随高清版一同展现
《基于UHPLC-MS的代谢组学技术研究婴儿巨细胞病毒肝炎湿热内蕴证(英文)》
Note:aAUC=area under receiver operating characteristic curve;bCI=confi-dence interval P-values were calculated using Student’s t-test,**P<0.01.
To further characterize the predictive value of the identified metabolites in discriminating HCMV hepatitis from NCs,we carried out the ROC analysis.ROC analysis was made based on the logistic regression of differential clinical indicators and differential metabolites between the two groups.The predictive utility of the ROC curve was measured using area under the curve(AUC),and a value close to 1was considered as perfect discrimination[15].As shown in Figure 4and Figure 5,lipid sphingomyelin(SM)and triglycerides(TGs)were potential sensitive and specific biomarkers for HCMV infection.In addition,biomarkers with AUC values greater than 0.9were listed in Table 3.
| 图表编号 | XD0038492800 严禁用于非法目的 |
|---|---|
| 绘制时间 | 2019.01.15 |
| 作者 | 李维薇、汪受传、单进军、谢彤、林丽丽、贺丽丽、杜丽娜、杨燕 |
| 绘制单位 | 南京中医药大学附属医院、南京中医药大学中医儿科学研究所、南京中医药大学附属医院、南京中医药大学中医儿科学研究所、南京中医药大学中医儿科学研究所、南京中医药大学中医儿科学研究所、南京中医药大学附属中西医结合医院、首都医科大学附属北京儿童医院、首都医科大学附属北京儿童医院 |
| 更多格式 | 高清、无水印(增值服务) |


