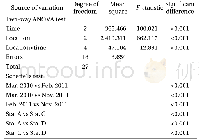
《Table 1 Results of two-way ANOVA analyzing effects of genotype (G) and environmental condition (E)
 提示:宽带有限、当前游客访问压缩模式
本系列图表出处文件名:随高清版一同展现
《Variation and heritability of morphological and physiological traits among Leymus chinensis genotypes under different environmental conditions》
Note:Pmax,the maximum net photosynthetic rate;SLA,specific leaf area;LL/LW,leaf length/leaf width ratio.
The canonical discriminant analysis of environmental conditions revealed the clustering of the 102significant eigenvectors,which collectively explained about 96.04%of the total variance(Table 3)and clearly separated individuals by environmental condition(Fig.2a).The traits with the significant weights on the first canonical variate(CV1)were Pmax and all the growth and production traits except the maximum shoot height(Table 3),and CV1 clearly distinguished Ck(with high Pmax and high ability of growth and production)at the positive end of the Axis 1 from the other environmental conditions,with DrHt at the negative end of the Axis 1(Fig.2a).The traits with the significant weights on the second canonical variate(CV2)were maximum shoot height and SLA(Table 3),and CV2 distinguished Ht(with high maximum shoot height and high SLA,at the top of the Axis 2)and Dr(at the bottom of the Axis 2)from DrHt.
| 图表编号 | XD0031565800 严禁用于非法目的 |
|---|---|
| 绘制时间 | 2019.02.01 |
| 作者 | YANG Xue、LI Junpeng、ZHAO Tingting、MO Lidong、ZHANG Jianli、REN Huiqin、ZHAO Nianxi、GAO Yubao |
| 绘制单位 | Department of Plant Biology and Ecology, College of Life Science, Nankai University、Department of Plant Biology and Ecology, College of Life Science, Nankai University、Department of Plant Biology and Ecology, College of Life Science, Nankai University、Dep |
| 更多格式 | 高清、无水印(增值服务) |
查看“Table 1 Results of two-way ANOVA analyzing effects of genotype (G) and environmental condition (E) on 10traits of L.chin”的人还看了
-

- 表2 接种和干旱处理对土沉香叶绿素含量双因素方差分析结果Table 2 The results of two-way ANOVA for effects of mycorrhizal inoculation and drought stre
-

- 表4 接种和干旱处理对土沉香生理生化指标含量双因素方差分析结果Table 4 The results of two-way ANOVA for effects of mycorrhizal inoculation and drought s


