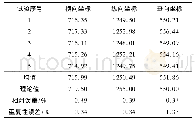
《Table 1 Contrast of subcritical measurement with theoretical value》
It can be seen from the results of the above data that the correction effect of the next criticality in the deep subcritical state is obvious,and the relative deviation is almost close to 0at the existing deepest subcriticality,which is sufficient to explain the correction effect.However,in the shallow critical state,the correction effect is not obvious.According to the subcriticality measurement results,the preliminary conclusion is given that the measurement of the subcriticality by considering the spatial effect and the source distribution effect correction method has certain effects,but in the shallow subcritical state,or for the value of the small control rod,it is necessary to include background counting and other additional considerations.
| 图表编号 | XD0027849500 严禁用于非法目的 |
|---|---|
| 绘制时间 | 2019.07.01 |
| 作者 | 梁松、陈晓亮 |
| 绘制单位 | 反应堆工程技术研究部 |
| 更多格式 | 高清、无水印(增值服务) |
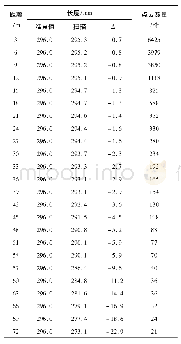
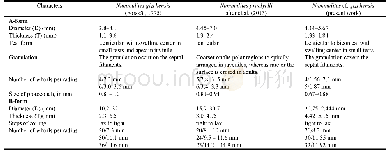
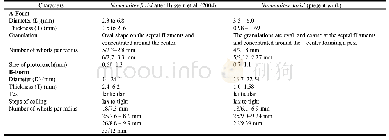
查看“Table 1 Contrast of subcritical measurement with theoretical value”的人还看了
-
- Table 1 Comparison of measurements of Nummulites farisi (after Hussein et al.2004) with the present work
-
- Table 7 Comparison of measurements of Nummulites praestriatus (after Boukhary and Kamal, 1993) with the present work
 提示:宽带有限、当前游客访问压缩模式
