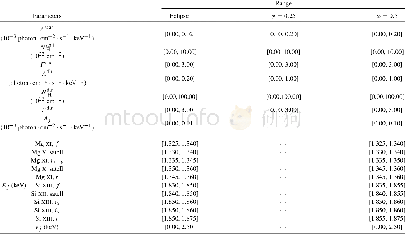
《Table 2.The range of each parameter which needs to be marginalized in prior functions.》
 提示:宽带有限、当前游客访问压缩模式
本系列图表出处文件名:随高清版一同展现
《Physical parameter estimation with MCMC from observations of Vela X-1》
The best-fit parameters and their uncertainties of Fcont and Fline are listed in Tables 3–5.Figures 2,3 and 4 show Fcont and Fline implied by our fits using the models of Equations(5)and(6),respectively.The black lines and gray shadows are the observed flux-corrected spectra and observation errors,respectively.The red thick lines show Fcont and Fline for the most likely parameters,and the band of light red lines shows a 1-σsampling of the posterior PDFs returned by emcee for Fcont and Fline.For Fcont,the contributions from scatter and direct components are individually shown in blue and purple dashed lines,respectively.Error regions of parameters are directly derived from 68%confidence interval of the posterior PDFs of fitted parameters.It can be seen that the residuals between models and observations scatter around zero,which proves the fits are unbiased.
| 图表编号 | XD0027422700 严禁用于非法目的 |
|---|---|
| 绘制时间 | 2018.06.30 |
| 作者 | Lan Zhang、Feilu Wang、Xiangxiang Xue、Dawei Yuan、Huigang Wei、Gang Zhao |
| 绘制单位 | Key Laboratory of Optical Astronomy, National Astronomical Observatories, Chinese Academy of Sciences、Key Laboratory of Optical Astronomy, National Astronomical Observatories, Chinese Academy of Sciences、School of Astronomy and Space Science, University o |
| 更多格式 | 高清、无水印(增值服务) |
查看“Table 2.The range of each parameter which needs to be marginalized in prior functions.”的人还看了
-

- 表2 清洗次数与待测溶液中主要基质元素含量的关系Tab.2 The content of main matrix elements in the solutions to be tested after solid phase extrac


