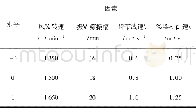
《Table 1.Simulated and Experimental Trap Stiffnessa》
 提示:宽带有限、当前游客访问压缩模式
本系列图表出处文件名:随高清版一同展现
《Sequential trapping of single nanoparticles using a gold plasmonic nanohole array》
aTheoretical stiffness calculations and experimental observations were normalized to an incident laser intensity of 1 mW∕μm2.
The electric field distributions on the xy plane at z?18 nm and the yz plane at x?0 nm are shown in Figs.4(a)and 4(b),respectively.The potential of the trapped nanoparticle as a function of the x direction is plotted in Fig.4(c).From the simulated potential results in the x and z directions,the equilibrium position is at x?0 nm and z?18 nm.To obtain the potential profile along the y direction,the nanoparticle was placed 2 nm above the interface between the water and the gold film(i.e.,at x?0 nm,z?-17 nm),the result of which is shown in Fig.4(d).The full width at half-maximum(FWHM)for the x and y directions are 45 and 48 nm,respectively.For a particle at a position r(x,y,z),by assessing the simulated forces and the FWHM values of the corresponding trapping potentials in Figs.3 and 4,we calculated the trap stiffness,ktot,using the following standard formula F?ktot·r,where ktot?fkx,ky,kzg represents the complex component of trap stiffness for the x,y and z directions.The results are shown in Table 1.
| 图表编号 | XD0023404900 严禁用于非法目的 |
|---|---|
| 绘制时间 | 2018.10.10 |
| 作者 | XUE HAN、VIET GIANG TRUONG、PRINCE SUNIL THOMAS、SíLE NIC CHORMAIC |
| 绘制单位 | Light-Matter Interactions Unit, Okinawa Institute of Science and Technology Graduate University、Light-Matter Interactions Unit, Okinawa Institute of Science and Technology Graduate University、Light-Matter Interactions Unit, Okinawa Institute of Science an |
| 更多格式 | 高清、无水印(增值服务) |


