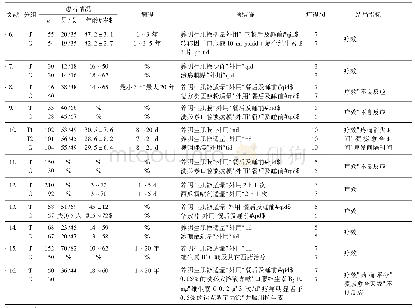
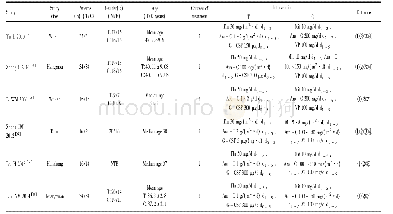
《Tab.1 Computational details of the fan simulation, including the disk space for 2 000 samples used
To further quantify the impact of the mesh,Fig.10and Fig.11 show axial distributions of the pressure coefficient and the turbulent kinetic anergy at 80%span and two circumferential locations,i.e.,Θ=-45°andΘ=-35°.Upstream of the blade,the pressure coefficients in Fig.10 shows a smooth drop due to the suction region.Larger values are observed on the pressure side of the blade,as already observed in Fig.8(b).The impact of the mesh on the pressure coefficient negligibly small and the curves almost perfectly match for both locations.The turbulent kinetic energy distribution in Fig.11 shows high values on pressure side of the blade due to the turbulent wake generated by tip-gap vortex of the neighboring blade.Only a small impact of the grid resolution at both location its observed.
| 图表编号 | XD0017586700 严禁用于非法目的 |
|---|---|
| 绘制时间 | 2018.02.26 |
| 作者 | Alexej Pogorelov、Matthias Meinke、Wolfgang Schroder |
| 绘制单位 | Institute of Aerodynamics,RWTH Aachen University、Institute of Aerodynamics,RWTH Aachen University、Institute of Aerodynamics,RWTH Aachen University |
| 更多格式 | 高清、无水印(增值服务) |
 提示:宽带有限、当前游客访问压缩模式


