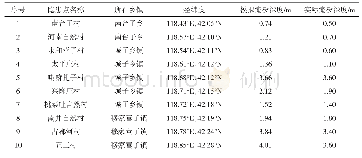
《表3:淹没深度与损失率折算关系》
注该损失率折算关系参考史瑞琴等人的洪涝损失评估研究(参见参考文献[32]),未考虑农作物种类的差别。
where j stands for the type of indicator;i for the indicator value;zj for the normalized value of the j type indicator;xji for the value of the j type indicator;min xj for the minimum value of the j type indicator;and max xj for the maximum value of the j type indicator.Based on Equation(5),SI(sensitivity index)is the normalized index total of the financial loss of dry and water farming areas;and AI(adaptation index)is the normalized index total of indicators such as local fiscal revenue,proportion of agricultural/illiterate population,mileage per unit area,and forest coverage.
| 图表编号 | XD00162295100 严禁用于非法目的 |
|---|---|
| 绘制时间 | 2020.06.01 |
| 作者 | 陈崇贤、夏宇、杨潇豪 |
| 绘制单位 | 华南农业大学林学与风景园林学院、华南农业大学林学与风景园林学院、美国密歇根大学环境与可持续发展学院 |
| 更多格式 | 高清、无水印(增值服务) |
 提示:宽带有限、当前游客访问压缩模式


