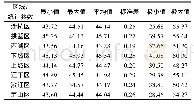
《表2 典型道路区域事故数据统计Tab.2 Data statistics of accidents in typical road areas》
在此选择Islington区域和Sutton区域作为对比区域,根据公式(1)可得Fs(Islington)=1.91,Fs(Sutton)=0.77。选取Islington的A501道路区域和Sutton的Green Wrythe Lane道路区域进行事故数统计,统计时段为2011—2015年,统计结果见表2。
| 图表编号 | XD0012723000 严禁用于非法目的 |
|---|---|
| 绘制时间 | 2018.05.25 |
| 作者 | 曾令秋、王瑞梅、韩庆文、曾孜、朱颖祥、张程 |
| 绘制单位 | 重庆大学计算机学院、重庆大学计算机学院、重庆大学通信工程学院、重庆市第七中学校、重庆大学通信工程学院、重庆大学计算机学院 |
| 更多格式 | 高清、无水印(增值服务) |
查看“表2 典型道路区域事故数据统计Tab.2 Data statistics of accidents in typical road areas”的人还看了
-

- 表4 渤海5个典型港口分类数据统计Tab.4 Statistics of classification data of five typical ports in the Bohai Sea region
-

- 表2 黄海中部泥质区及典型区域沉积物中重金属背景值比较Tab.2 Background data of heavy metals in the muddy area of the middle Yellow Sea and the othe
 提示:宽带有限、当前游客访问压缩模式


