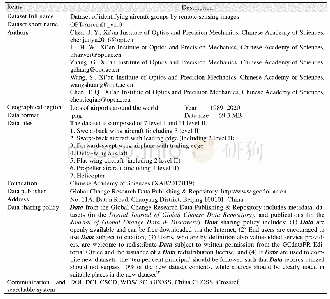
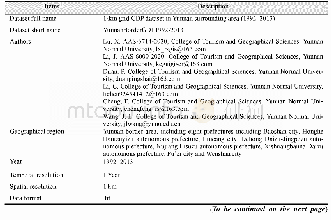
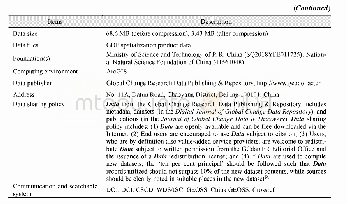
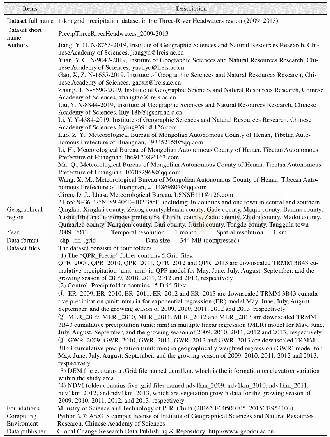
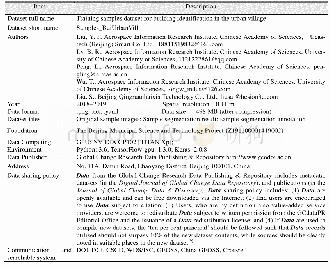
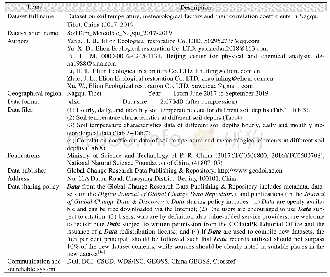
《Table 2 Metadata summary of“Extreme temperature grid dataset in coastal area of China”》
where Y represents the extreme temperature index,t is the time,a refers to the linear trend term,b is the constant term,and a?10 represents the change of the extreme temperature index during every 10 a,namely inter-annual rate of change,in unit of oC/10a or d/10 a.Vector data in.shp format in terms of multi-year average and inter-annual magnitude of 16extreme temperature indices at 156 meteorological stations in the coastal area of China were produced by ArcGIS software,and then raster data in.tif format was generated by extending the site data of each extreme temperature index at meteorological scale to continuous space using Inverse Distance Weight method.
| 图表编号 | XD00110305300 严禁用于非法目的 |
|---|---|
| 绘制时间 | 2019.03.25 |
| 作者 | 王晓利、侯西勇 |
| 绘制单位 | 中国科学院烟台海岸带研究所、中国科学院海岸带环境过程与生态修复重点实验室、中国科学院烟台海岸带研究所、中国科学院海岸带环境过程与生态修复重点实验室 |
| 更多格式 | 高清、无水印(增值服务) |
 提示:宽带有限、当前游客访问压缩模式
