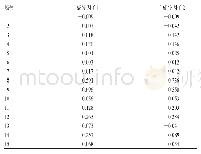
《表7 拟合误差系数所对应的最优平滑系数Tab.7 The optimal smoothing coefficient corresponding to the fitting error coeff
 提示:宽带有限、当前游客访问压缩模式
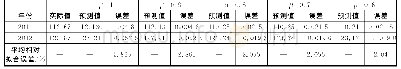
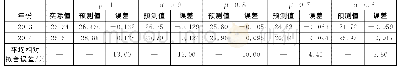
通过三次指数平滑法进行预测得到如下结果:表7所示为拟合误差系数β=0.6,0.7,0.8,0.9,1所对应的最优平滑系数α值。表8为拟合误差系数β=0.6,0.7,0.8,0.9,1所对应最后两期预测对比情况。
| 图表编号 | XD0029994300 严禁用于非法目的 |
|---|---|
| 绘制时间 | 2019.02.25 |
| 作者 | 夏家盛、吉培荣 |
| 绘制单位 | 三峡大学电气与新能源学院、三峡大学电气与新能源学院 |
| 更多格式 | 高清、无水印(增值服务) |


