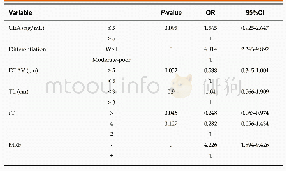
《Table 3 Multivariate Cox regression analysis conducted in TCGA for overall survival and progression
 提示:宽带有限、当前游客访问压缩模式
本系列图表出处文件名:随高清版一同展现
《基于预后相关基因构建的分析模型可识别高风险胶质母细胞瘤(英文)》
Previously,several known molecular features have been verified to be associated with survival times of GBM patients.Hence,the relationship of our risk score system with the previously described molecular classifications and clinicopathologic features was analyzed(Table 4,5).Here,we found almost all the tumors in the high-risk group were IDH wild type.With TCGA classifications,we found that most tumors of the mesenchymal subtype were clustered in the high-risk group while most tumors of the proneural and neural subtypes fell in the low-risk group.We also rearranged the GBM samples in two datasets according to their risk scores,and the hierarchical clustering showed that 17 survival-related genes exhibited distinct expression patterns between the low-risk and high-risk groups(Figure7).The high-risk group expressed higher levels of risky genes and lower levels of protective genes as compared to the low-risk group.Furthermore,we performed statistical analysis(t test)for the distribution of risk scores among various molecular subtypes.The mesenchymal subgroup showed higher risk scores in comparison with the other TCGA classifications(classical,proneural and neural subtypes),and the IDH wild type group had higher risk scores than IDH mutant group(Figure 7).These results indicated that our risk scoring system was associated with clinical characteristics and high risk scores positively correlated with risky clinicopathologic features.
| 图表编号 | XD0026937200 严禁用于非法目的 |
|---|---|
| 绘制时间 | 2018.04.01 |
| 作者 | 陈弟、陈迪康、曹冬青、胡建、姚瑜 |
| 绘制单位 | 复旦大学附属华山医院神经外科、复旦大学附属华山医院神经外科、复旦大学附属华山医院神经外科免疫室、德克萨斯大学安德森癌症中心癌症生物学系、复旦大学附属华山医院神经外科、复旦大学附属华山医院神经外科免疫室 |
| 更多格式 | 高清、无水印(增值服务) |
查看“Table 3 Multivariate Cox regression analysis conducted in TCGA for overall survival and progression-free survival”的人还看了
-

- Table 1 Univariate/multivariate Cox regression analysis of clinicopathologic factors associated with overall survival in
-

- Table 2 Multivariate regression analysis of cervical lymph node metastasis in papillary thyroid carcinoma patients
-

- Table 4 Predictive factors for good downstaging in multivariate logistic regression analysis for all patients


