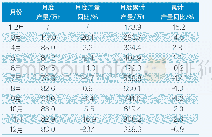
《Table 2 Energy intensive product output scenario in IPAC》
 提示:宽带有限、当前游客访问压缩模式
本系列图表出处文件名:随高清版一同展现
《Transition scenarios of power generation in China under global 2℃ and 1.5℃ targets》
This section presents the key parameters used in the IPAC modeling analysis of the two scenarios,where population and macro-economy parameters are kept constant.These parameters have been documented in previous publications.Table 1 presents the population scenario.The GDP growth used here was revised using previous IPAC studies and recent development trends in China.GDP growth and structure changes were calculated using the IPAC-SGM model,which is a CGE model.Fig.2presents the GDP assumption in the IPAC model,and presents structural changes in the secondary sector[9][14].
| 图表编号 | XD0020053300 严禁用于非法目的 |
|---|---|
| 绘制时间 | 2018.10.01 |
| 作者 | Kejun Jiang、Chenmin He、Xiangyang Xu、Weiyi Jiang、Pianpian Xiang、Hong Li、Jia Liu |
| 绘制单位 | Energy Research Institute、Peking University、China University of Mining and Technology、Sydney University、Tsinghua University、Renm Consulting、Renm Consulting |
| 更多格式 | 高清、无水印(增值服务) |
查看“Table 2 Energy intensive product output scenario in IPAC”的人还看了
-

- Table 2 Experimental results in three different scenarios performed with one input/one output models


