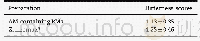
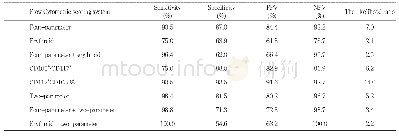
《Table 2–Bitterness scores for azithromycin-containing reverse micelle and Zithromaxsolutions (n=8)
 提示:宽带有限、当前游客访问压缩模式
本系列图表出处文件名:随高清版一同展现
《Creation of an assessment system for measuringthe bitterness of azithromycin-containing reversemicelles》
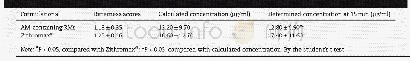
The fitting results are shown in Table 3 and Fig.4.A logistic equation(correlation coefficient R 2 of 0.99067)was derivedas the relationship between bitterness scores and log of the azithromycin standard concentrations.This was used to calculate the bitterness scores from the azithromycin drug release concentrations of the Zithromax?and azithromycincontaining reverse micelle formulations.
| 图表编号 | XD00186272000 严禁用于非法目的 |
|---|---|
| 绘制时间 | 2018.07.01 |
| 作者 | Ri Huang、Yadan Zhang、Tao Wang、Liao Shen、Zhen Zhang、Yang Wang、Dongqin Quan |
| 绘制单位 | Institute of Pharmacology and Toxicology, Academy of Military Medical Sciences、Experimental Teaching Administration Department, TianjinU niversity of Traditional Chinese Medicine、Institute of Pharmacology and Toxicology, Academy of Military Medical Scienc |
| 更多格式 | 高清、无水印(增值服务) |
