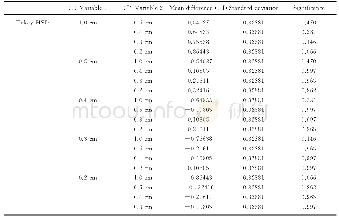
《Tab.2 Average water temperature in different months and corresponding BOD5degradation coefficient a
According to the corresponding relationship between average water temperature and BOD5degradation coefficient in each month(Tab.2),the degradation coefficient increases with the increase of temperature.From January to March,the average water temperature is 9.5℃,and the average degradation coefficient is 0.028/d.In April,the water temperature rises to 14.7℃and the degradation coefficient increases to 0.039/d,while in July,the water temperature further rises to 26.5℃,and the degradation coefficient reaches 0.054/d.Fig.5shows that through the pairwise combination of different months,the logarithm difference of average water temperature difference and BOD5degradation coefficient shows a good linear relationship(P<0.01),the fitting slope lnθis 0.386,and the calculated temperature correction coefficientθis 1.039.
| 图表编号 | XD00167695300 严禁用于非法目的 |
|---|---|
| 绘制时间 | 2020.06.01 |
| 作者 | 王超、贾庆林、裴中平、王树磊、张爱静、尹炜 |
| 绘制单位 | 长江水资源保护科学研究所、长江水资源保护科学研究所、河海大学环境学院、长江水资源保护科学研究所、南水北调中线干线工程建设管理局、南水北调中线干线工程建设管理局、长江水资源保护科学研究所 |
| 更多格式 | 高清、无水印(增值服务) |
查看“Tab.2 Average water temperature in different months and corresponding BOD5degradation coefficient along the main channel”的人还看了
-

- Attached Tab.ⅠThe differences in average cell density of Microcystis in water column calculated by the surface thickness
 提示:宽带有限、当前游客访问压缩模式


