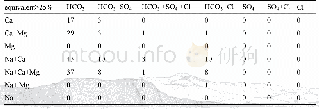
《Table 2 Groundwater balance》
 提示:宽带有限、当前游客访问压缩模式
本系列图表出处文件名:随高清版一同展现
《Numerical simulation of response of groundwater flow system in inland basin to density changes》
According to the model setting,all the sources of ideal model are from river infiltration replenishment.Model calculation results show(Table 2)that most of the groundwater is drained in the form of springs,accounting for 57.15%of the total discharge volume.Some of them is consumed in the form of evaporation,accounting for 34.28%.Although the evaporation distribution area accounts for the vast area of the total discharge area,the proportion of evaporative emission is not large.Mainly because the middle part of the basin is a lacustrine plain with poor permeability of aquifer layers and a small part of groundwater is discharged in the form of rivers.
| 图表编号 | XD0016466200 严禁用于非法目的 |
|---|---|
| 绘制时间 | 2018.03.01 |
| 作者 | LI Lu-lu、SU Chen、HAO Qi-chen、SHAO Jing-li |
| 绘制单位 | School of Water Resources & Environment, China University of Geosciences in Beijing、The Institute of Hydrogeology and Environmental Geology, Chinese Academy of Geological Science、The Institute of Hydrogeology and Environmental Geology, Chinese Academy of |
| 更多格式 | 高清、无水印(增值服务) |


