《ENGINEERING STATISTICS》
| 作者 | 编者 |
|---|---|
| 出版 | 未查询到或未知 |
| 参考页数 | 585 |
| 出版时间 | 没有确切时间的资料 目录预览 |
| ISBN号 | 无 — 求助条款 |
| PDF编号 | 811443928(仅供预览,未存储实际文件) |
| 求助格式 | 扫描PDF(若分多册发行,每次仅能受理1册) |

Chapter ⅠHistograms and Empirical Distributions1
1.1 Introduction1
1.2 Empirical Distributions2
1.3 Measures of Central Tendency7
1.4 Measures of Variation8
1.5 Computation of the Mean and Standard Deviation from the Frequency Table9
Chapter Ⅱ Random Variables and Probability Distributions13
2.1Introduction13
2.2 Set of All Possible Outcomes of the Experiment14
2.3 Random Variables16
2.4 Probability and Probability Distributions19
2.5 Discrete Probability Distributions22
2.6 Continuous Probability Distributions25
2.7 Random Sample29
2.8 Expectation30
2.9 Moments31
2.10 Some Properties of Random Variables35
Chapter Ⅲ The Normal Distribution40
3.1Definitions40
3.2The Mean and Variance of the Normal Distribution41
3.2.1 Evaluation of the Mean and Variance43
3.3 Tables of the Normal Integral44
3.4 Combinations of Normally Distributed Variables48
3.5 The Standardized Normal Random Variable49
3.6 The Distribution of the Sample Mean50
3.7 Tolerances51
3.8 Tolerances in Complex Items59
3.9 The Central Limit Theorem64
Chapter Ⅳ Other Probability Distributions70
4.1Introduction70
4.2The Chi-Square Distribution71
4.2.1 The Chi-Square Random Variable71
4.2.2 The Addition Theorem74
4.2.3 The Distribution of the Sample Variance75
4.3 The t-Distribution78
4.3.1 The t-Random Variable78
4.3.2 The Distribution of ?81
4.3.3 The Distribution of the Difference Between Two Sample Means82
4.4The F Distribution84
4.4.1 The F Random Variable84
4.4.2 The Distribution of the Ratio of Two Sample Variances86
4.5The Binomial Distribution87
4.5.1 The Binomial Random Variable87
4.5.2 Tables of the Binomial Probability Distribution89
4.5.3 The Normal Approximation to the Binomial90
4.5.4 The Arc Sine Transformation91
4.5.5 The Poisson Approximation to the Binomial92
Chapter Ⅴ Significance Tests96
5.1Introduction96
5.2 The Operating Characteristic Curve98
5.3 One- and Two-Sided Procedures103
5.4 Statistical Decision Theory109
Chapter ⅥTests of the Hypothesis about a Single Parameter111
6.1Tests of the Hypothesis that the Mean of a Normal Distribution Has a Specified Value when the Standard Deviation Is Known111
6.1.1 Choice of an OC Curve111
6.1.2 Tables and Charts for Determining Decision Rules113
6.1.2.1 Tables and Charts for Two-Sided Procedures113
6.1.2.2 Summary for Two-Sided Procedures116
6.1.2.3 Tables and Charts for One-Sided Procedures117
6.1.2.4 Summary for One-Sided Procedures119
6.1.2.5 Tables and Charts for OC Curves120
6.1.3 Analytical Determination of Decision Rules122
6.1.3.1 Acceptance Regions and Sample Sizes122
6.1.3.2 The OC Curve125
6.1.4 Example126
6.2 Test of the Hypothesis that the Mean of a Normal Distribution Has a Specified Value when the Standard Deviation Is Unknown127
6.2.1 The Choice of an OC Curve127
6.2.2 Tables and Charts for Carrying Out t Tests129
6.2.2.1 Tables and Charts for Two-Sided Procedures130
6.2.2.2 Summary for Two Sided Procedures131
6.2.2.3 Tables and Charts for One-Sided Procedures131
6.2.2.4 Summary for One-Sided Procedures134
6.2.2.5 Tables and Charts for OC Curves134
6.2.3 Examples of t Tests136
6.3Test of the Hypothesis that the Standard Deviation of a Normal Distribution Has a Specified Value137
6.3.1 Choice of an OC Curve137
6.3.2Charts and Tables to Design Tests of Dispersion138
6.3.2.1 Tables and Charts for Two-Sided Procedures138
6.3.2.2 Summary for Two-Sided Procedure Using Tables and Charts140
6.3.2.3 Tables and Charts for One-Sided Procedures140
6.3.2.4 Summary for One-Sided Procedures Using Tables and Charts143
6.3.2.5 Tables and Charts for Operating Character-istic Curves144
6.3.3 Analytical Treatment for Chi-Square Tests145
6.3.4 Example147
Chapter Ⅶ Tests of Hypotheses about Two Parameters156
7.1 Test of the Hypothesis that the Means of Two Normal Distribu-tions Are Equal when Both Standard Deviations Are Known156
7.1.1Choice of an OC Curve156
7.1.2 Tables and Charts for Determining Decision Rules157
7.1.2.1 Tables and Charts for Two-Sided Procedures157
7.1.2.2 Summary for Two-Sided Procedures Using Tables and Charts159
7.1.2.3 Summary for One-Sided Procedures Using Tables and Charts159
7.1.2.4 Tables and Charts for Operating Character-istic Curves161
7.1.3Analytical Determination of Decision Rules162
7.1.3.1 Acceptance Regions and Sample Sizes162
7.1.3.2 The Operating Characteristic Curve164
7.1.4 Example165
7.2 Test of the Hypothesis that the Means of Two Normal Distribu-tions Are Equal Assuming that the Standard Deviations Are Unknown but Equal166
7.2.1 Choice of an OC Curve166
7.2.2Tables and Charts for Carrying out Two Sample t Tests167
7.2.2.1 Tables and Charts for Two-Sided Procedures168
7.2.2.2 Summary for Two-Sided Procedures Using Tables and Charts169
7.2.2.3 Summary for One-Sided Procedures Using Tables and Charts169
7.2.2.4 Tables and Charts for Operating Character-istic Curves170
7.2.3 Example172
7.3 Test of the Hypothesis that the Means of Two Normal Distribu-tions Are Equal Assuming that the Standard Deviations Are Unknown and not Necessarily Equal173
7.3.1 Test Procedure173
7.3.2 Example174
7.4 Test for Equality of Means when the Observations Are Paired175
7.4.1 Test Procedure175
7.4.2 Example178
7.5 Non-parametric Tests179
7.5.1 The Sign Test179
7.5.2 The Wilcoxon Signed Rank Test179
7.5.3 A Test for Two Independent Samples184
7.6 Test of the Hypothesis that the Standard Deviations of Two Normal Distributions Are Equal186
7.6.1 Choice of an OC Curve186
7.6.2 Charts and Tables for Carrying out F Tests187
7.6.2.1 Tables and Charts for Two-Sided Procedures187
7.6.2.2 Summary for Two-Sided Procedures Using Tables and Charts189
7.6.2.3 Tables and Charts for One-Sided Procedures189
7.6.2.4 Summary for One-Sided Procedures Using Tables and Charts191
7.6.2.5 Tables and Charts for Operating Character-istic Curves192
7.6.3 Analytical Treatment for Tests193
7.6.4 Example195
7.7 Cochran’s Test for the Homogeneity of Variances198
Chapter ⅧEstimation211
8.1 Introduction211
8.2 Point Estimation211
8.3 Optimal Estimates214
8.4 Confidence Interval Estimation215
8.5Confidence Interval for the Mean of a Normal Distribution when the Standard Deviation Is Known216
8.5.1 Example217
8.6Confidence Interval For the Mean of a Normal Distribution when the Standard Deviation Is Unknown217
8.6.1 Example218
8.7Confidence Interval for the Standard Deviation of a Normal Distribution219
8.7.1 Example219
8.8Confidence Interval for the Differen between the Means of Two Normal Distributions when the Standard Deviations Are Both Known220
8.8.1 Example221
8.9Confidence Interval for the Difference between the Means of Two Normal Distributions where the Standard Deviations Are Both Unknown but Equal221
8.9.1 Example222
8.10 Confidence Interval for the Ratio of Standard Deviations of Two Normal Distributions223
8.10.1 Example224
8.11 A Table of Point Estimates and Interval Estimates224
8.12 Statistical Tolerance Limits224
8.12.1 Example228
8.13 One-Sided Statistical Tolerance Limits229
8.13.1 Example229
8.14 Distribution-Free Tolerance Limits229
Chapter ⅨFitting Straight Lines238
9.1 Introduction238
9.2 Types of Linear Relationships242
9.3Least Squares Estimates of the Slope and Intercept243
9.3.1 Formulation of the Problem and Results243
9.3.2 Theory245
9.4Confidence Interval Estimates of the Slope and Intercept246
9.4.1 Formulation of the Problem and Results246
9.4.2 Theory248
9.5Point Estimates and Confidence Interval Estimates of the Average Value of y for a Given x249
9.5.1 Formulation of the Problem and Results249
9.5.2 Theory250
9.6 Point Estimates and Interval Estimates of the Independent Variable x Associated with an Observation on the Dependent Variable y251
9.7Prediction Interval for a Future Observation on the Dependent Variable253
9.7.1 Formulation of the Problem and Results253
9.7.2 Theory254
9.8 Tests of Hypotheses about the Slope and Intercept255
9.9 Estimation of the Slope B when A is Known to be Zero257
9.10 Ascertaining Linearity259
9.11 Transforming to a Straight Line261
9.12 Work Sheets for Fitting Straight Lines264
9.13 Illustrative Examples264
9.14 Correlation273
Chapter ⅩAnalysis of Variance286
10.1 Introduction286
10.2 Model for the One-Way Classification287
10.2.1 Fixed Effects Model287
10.2.2 Random Effects Model289
10.2.3 Further Examples of Fixed Effects and of the Random Effects Models290
10.2.4 Computational Procedure: One-Way Classification290
10.2.5The Analysis of Varian Procedu292
10.2.5.1 A Heuristic Justification292
10.2.5.2 The Partition Theorem293
10.2.6 Analysis of the Fixed Effects Model: One-Way Clas-sification294
10.2.7 The OC Curve of the Analysis of Variance for the Fixed Effects Model299
10.2.8 Example Using the Fixed Effects Model305
10.2.9 Analysis of the Random Effects Model307
10.2.10 The OC Curve for the Random Effects Model307
10.2.11 Example Using the Random Effects Model313
10.2.12 Randomization Tests in the Analysis of Variance314
10.3Two-Way Analysis of Variance, One Observation per Combina-tion315
10.3.1 Fixed Effects Model316
10.3.2 Random Effects Model319
10.3.3 Mixed Fixed Effects and Random Effects Model319
10.3.4 Computational Procedure, Two-Way Classification, One Observation per Combination320
10.3.5 Analysis of the Fixed Effects Model, Two-Way Classification, One Observation per Combination321
10.3.6 The OC Curve of the Analysis of Variance for the Fixed Effects Model: Two-Way Classification, One Observation per Combination324
10.3.7 Example Using the Fixed Effects Model325
10.3.8 Analysis of the Random Effects Model: Two-Way Classification, One Observation per Combination327
10.3.9 The OC Curve for the Random Effects Model: Two-Way Classification328
10.3.10 Example Using the Random Effects Model329
10.3.11 Analysis of the Mixed Effects Model, Two-Way Classification, One Observation per Combination330
10.3.12 The OC Curve of the Analysis of Variance for the Mixed Effects Model, Two-Way Classification, One Observation per Cell331
10.3.13 Example Using the Mixed Effects Model332
10.4Two-Way Analysis of Variance, n Observations per Combination332
10.4.1 Description of the Various Models332
10.4.2 Computational Procedure, Two-Way Classification, n Observations per Cell334
10.4.3 Analysis of the Fixed Effects Model, Two-WayClassification, n Observations per Combination335
10.4.4 The OC Curve of the Analysis of Variance for the Fixed Effects Model, Two-Way Classification, n Observations per Cell339
10.4.5 Example Using the Fixed Effects Model, Two-Way Classification, Three Observations per Combination340
10.4.6 Analysis of the Random Effects Model, Two-Way Classification, n Observations per Combination342
10.4.7 The OC Curve of the Random Effects Model, Two-Way Classification, n Observations per Combination344
10.4.8 Example Using the Random Effects Model345
10.4.9 Analysis of the Mixed Effects Model, Two-Way Classification, n Observations per Cell345
10.4.10 The OC Curve of the Analysis of Variance for the Mixed Effects Model, Two-Way Classification, One Observation per Cell347
10.4.11 Example Using the Mixed Effects Model347
10.5 Summary of Models and Tests349
Chapter ⅩⅠAnalysis of Enumeration Data365
11.1 Enumeration Data365
11.2 Chi-Square Tests365
11.3 The Hypothesis Completely Specifies the Theoretical Frequency366
11.3.1 Dichotomous Data367
11.4 Test of Independence in a Two-Way Table369
11.4.1 Computing Form for Test of Independence in a 2 by 2 Table370
11.5 Comparison of Two Percentages371
11.6 Confidence Intervals for Proportion372
11.6.1 Exact Confidence Intervals for p373
11.6.2 Normal Approximations to Confidence Intervals373
Chapter ⅩⅡStatistical Quality Control: Control Charts378
12.1 Introduction378
12.2 Obtaining Data From Rational Subgroups378
12.3Control Chart for Variables: ? - Charts379
12.3.1 Statistical Concepts379
12.3.2 Estimates of ?’381
12.3.3 Estimate of ?’ by ?381
12.3.4 Estimate of ?’ by ?383
12.3.5 Starting a Control Chart for ?383
12.3.6 Relation Between Natural Tolerance Limits and Specification Limits384
12.3.7 Interpretation of Control Charts for ?385
12.4R Charts and ? Charts387
12.4.1 Statistical Concepts387
12.4.2 Setting up a control chart for R or ?388
12.5 Example of ? and R Chart389
12.6Control Chart For Fraction Defective391
12.6.1 Relation Between Control Charts Based on Variables Data and Charts Based on Attributes Data391
12.6.2 Statistical Theory391
12.6.3 Starting the Control Chart393
12.6.4 Continuing the p Chart394
12.6.5 Example395
12.7Control Charts For Defects395
12.7.1 Difference Between a Defect and a Defective395
12.7.2 Statistical Theory396
12.7.3 Starting and Continuing the c Chart396
12.7.4 Example396
Chapter ⅩⅢSampling lnspection402
13.1The Problem of Sampling Inspection402
13.1.1 Introduction402
13.1.2 Drawing the Sample403
13.2Lot-by-Lot Sampling Inspection by Attributes404
13.2.1Single Sampling Plans404
13.2.1.1 Single Sampling404
13.2.1.2 Choosing a Sampling Plan406
13.2.1.3 Calculation of OC Curves for Single Sampling Plans407
13.2.1.4 Example407
13.2.2Double Sampling Plans413
13.2.2.1 Double Sampling413
13.2.2.2 OC Curves for Double Sampling Plans413
13.2.2.3 Example414
13.2.3 Multiple Sampling Plans415
13.2.4Classification of Sampling Plans416
13.2.4.1 Classification By AQL416
13.2.4.2 Classification By LTPD416
13.2.4.3 Classification By Point of Control416
13.2.4.4 Classification By AOQL417
13.2.5Dodge-Romig Tables418
13.2.5.1 Single Sampling Lot Tolerance Tables418
13.2.5.2 Double Sampling Lot Tolerance Tables421
13.2.5.3 Single Sampling AOQL Tables421
13.2.5.4 Double Sampling AOQL Tables421
13.2.6Military Standard 105A424
13.2.6.1 History424
13.2.6.2 Classification of Defects425
13.2.6.3 Acceptable Quality Levels425
13.2.6.4 Normal, Tightened, and Reduced Inspection426
13.2.6.5 Sampling Plans427
13.2.7 Designing your Own Attribute Plan432
13.2.7.1Computing the OC Curve of a Single Sampling Plan457
13.2.7.2 Finding a Sampling Plan Whose OC Curve Passes Through Two Points457
13.2.7.3 Design of Item by Item Sequential Plans464
13.3 Lot-By-Lot Sampling Inspection By Variables467
13.3.1 Introduction467
13.3.2 General Inspection Criteria468
13.3.3Estimates of the Percent Defective470
13.3.3.1 Estimate of the Percent Defective when the Standard Deviation Is Unknown but Estimated by the Sample Standard Deviation470
13.3.3.2 Estimate of the Percent Defective when the Standard Deviation Is Unknown but Estimated by the Average Range471
13.3.3.3 Estimate of the Percent Defective when the Standard Deviation Is Known489
13.3.4 Comparison of Variables Procedures with M and k491
13.3.5The Military Standard for Inspection by Variables,MIL-STD-414492
13.3.5.1 Introduction492
13.3.5.2 Section A— General Description of Sampling Plans493
13.3.5.3 Section B — Variability Unknown,Standard Deviation Method494
13.3.5.4 Section C — Variability Unknown, Range Method510
13.3.5.5 Section D — Variability Known511
13.3.5.6 Example Using MIL-STD-414512
13.4Continuous Sampling Inspection513
13.4.1 Introduction513
13.4.2 Dodge Continuous Sampling Plans513
13.4.3 Multi-Level Sampling Plans537
13.4.4 The Dodge CSP-1 Plan without Control541
13.4.5 Wald-Wolfowitz Continuous Sampling Plans542
13.4.6 Girshick Continuous Sampling Plan543
13.4.7 Plans Which Provide for Termination of Production544
Appendix553
lndex569
《ENGINEERING STATISTICS》由于是年代较久的资料都绝版了,几乎不可能购买到实物。如果大家为了学习确实需要,可向博主求助其电子版PDF文件。对合法合规的求助,我会当即受理并将下载地址发送给你。
高度相关资料
-

- STATISTICS
- 1952 OXFORD UNIVERSITY PRESS
-

- STATISTICS
- 1978
-

- BUSINESS STATISTICS
- 1979

-
- Statistics
- 1976 W.B.Saunders Company.
-

- MANAGEMENT STATISTICS
- 1978 NELSON ADVANCED BUSINESS STUDIES
-

- STATISTICS FOR THE ENGINEERING AND COMPUTER SCIENCES
- 1984 DELLEN PUBLISHING COMPANY COLLIER MACMILLAN PUBLISHERS
-
- PROBABILITY AND STATISTICS IN CIVIL ENGINEERING AN INTRODUCTION
- 1986 NICHOLS PUBLISHING COMPANY NEW YORK
-
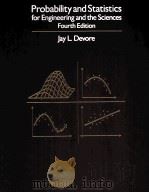
- PROBABILITY AND STATISTICS FOR ENGINEERING AND THE SCIENCES FOURTH EDITION
- 1995 DUXBURY PRESS
-

- INTRODUCTION TO PROBABILITY AND STATISTICS PRINCIPLES AND APPLICATIONS FOR ENGINEERING AND THE COMP
- 1990 MCGRAW-HILL PUBLISHING COMPANY
-
- INTRODUCTORY ENGINEERING STATISTICS 3RD EDITION
- 1965 JOHN WILEY & SONS
-
- EDUCATIONAL STATISTICS
- 1925 THE CENTURY CO.
-
- BUSINESS STATISTICS
- 1921 HARVARD UNIVERSITY PRESS
提示:百度云已更名为百度网盘(百度盘),天翼云盘、微盘下载地址……暂未提供。➥ PDF文字可复制化或转WORD