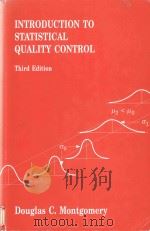
《INTRODUCTION TO STATISTICAL QUALITY CONTROL》
| 作者 | DOUGLAS C.MONTGOMERY 编者 |
|---|---|
| 出版 | 未查询到或未知 |
| 参考页数 | 520 |
| 出版时间 | 没有确切时间的资料 目录预览 |
| ISBN号 | 无 — 求助条款 |
| PDF编号 | 819605688(仅供预览,未存储实际文件) |
| 求助格式 | 扫描PDF(若分多册发行,每次仅能受理1册) |
1Quality Assurance In the Modern Business Environment1
1-1 THE MEANING OF QUALITY1
1-2 QUALITY ASSURANCE,TECHNOLOGY,AND PRODUCTIVITY3
1-3 QUALITY COSTS5
1-4 METHODS OF QUALITY ASSURANCE11
1-5 THE RESPONSIBILITY FOR QUALITY15
1-6 LEGAL ASPECTS17
1-7 SUMMARY19
PART ⅠSTATISTICAL METHODS USEFUL IN QUALITY ASSURANCE21
2Modeling Process Quality23
2-1 DESCRIBING VARIATION23
2-1.1 The Frequency Distribution and Histogram23
2-1.2 Numerical Summary of Data26
2-1.3 Probability Distributions28
2-2 IMPORTANT DISCRETE DISTRIBUTIONS33
2-2.1 The Hypergeometric Distribution33
2-2.2 The Binomial Distribution34
2-2.3 The Poisson Distribution36
2-2.4 The Pascal and Related Distributions37
2-3 IMPORTANT CONTINUOUS DISTRIBUTIONS38
2-3.1 The Normal Distribution38
2-3.2 The Exponential Distribution44
2-3.3 The Gamma Distribution46
2-3.4 The Weibull Distribution47
2-4 SOME USEFUL APPROXIMATIONS49
2-4.1 The Binomial Approximation to the Hypergeometric49
2-4.2 The Poisson Approximation to the Binomial50
2-4.3 The Normal Approximation to the Binomial50
2-4.4 Comments on Approximations51
2-5 EXERCISES52
3Inferences About Process Quality57
3-1 STATISTICS AND SAMPLING DISTRIBUTIONS58
3-1.1 Sampling from a Normal Distribution59
3-1.2 Sampling from a Bernoulli Distribution62
3-1.3 Sampling from a Poisson Distribution63
3-2 ESTIMATING PROCESS PARAMETERS64
3-2.1 Point Estimation65
3-2.2 Interval Estimation66
3-3 HYPOTHESIS TESTING ON PROCESS PARAMETERS75
3-3.1 Tests on Means,Variance Known77
3-3.2 Tests on Means of Normal Distributions,Variance Unknown79
3-3.3 Tests on Vsriances of Normal Distributions83
3-3.4 Tests on Binomial Parameters85
3-3.5 Tests on Poisson Parsmeters87
3-3.6 The Probability of Type Ⅱ Error89
3-4 EXERCISES92
PART ⅡSTATISTICAL PROCESS CONTROL99
4How the Control Chart Works101
4-1 CHANCE AND ASSIGNABLE CAUSES OF QUALITY VARIATION101
4-2 STATISTICAL BASIS OF THE CONTROL CHART102
4-2.1 Basic Principles102
4-2.2 Choice of Control Limits108
4-2.3 Sample Size and Sampling Frequency110
4-3 RATIONAL SUBGROUPS111
4-4 ANALYSIS OF PATTERNS ON CONTROL CHARTS112
4-5 NONMANUFACTURING APPLICATIONS OF CONTROL CHARTS115
4-6 EXERCISES116
5Control Charts for Attributes119
5-1 INTRODUCTION119
5-2 THE CONTROL CHAR r FOR FRACTION NONCONFORMING119
5-2.1 Development and Operation of the Control Chart121
5-2.2 Variable Sample Size133
5-2.3 The Operating-Characteristic Function139
5-3 CONTROL CHARTS FOR NONCONFORMITIES (DEFECTS)141
5-3.1 Procedures with Constant Sample Size142
5-3.2 Procedures with Variable Sample Size153
5-3.3 Demerit Systems155
5-3.4 The Operating-Characteristic Function156
5-4 EXERCISES158
6Control Charts for Variables171
6-1 INTRODUCTION171
6-2 CONTROL CHARTS FOR -x AND R173
6-2.1 Statistical Basis of the Charts173
6-2.2 Development and Use of -x and R Charts176
6-2.3 Charts Based on Standard Values188
6-2.4 Interpretation of -x and R Charts189
6-2.5 The Effect of Nonnormality on -x and R Charts192
6-2.6 The Operating-Characteristic Function193
6-3 OTHER CONTROL CHARTS FOR VARIABLES197
6-3.1 -x and S Control Charts197
6-3.2 The S2Control Chart199
6-3.3 Control Charts for Individual Units200
6-3.4 Control Limits Based on a Small Number of Samples202
6-4 CHOICE BETWEEN ATTRIBUTES AND VARIABLES CONTROL CHARTS203
6-5 SUMMARY OF PROCEDURES FOR -x,R,AND S CHARTS205
6-6 GUIDELINES FOR IMPLEMENTING CONTROL CHART PROGRAMS206
6-7 EXERCISES209
7Other Statistical Process-Control Techniques221
7-1 MODIFIED CONTROL CHARTS221
7-1.1 Basic Principles221
7-1.2 Alternative Designs for the Modified Control Chart224
7-2 THE CUMULATIVE-SUM CONTROL CHART225
7-2.1 Basic Principles225
7-2.2 Designing a Cumulative-Sum Control Chart229
7-2.3 Related Procedures230
7-3 CONTROL CHARTS BASED ON WEIGHTED AVERAGES235
7-3.1 The Moving-Average Control Chart235
7-3.2 The Geometric Moving-Average (GMA)Control Chart239
7-4 PRE-CONTROL243
7-5 METHODS FOR CONTROLLING SEVERAL RELATED QUALITY CHARACTERISTICS245
7-6 STATISTICAL ALTERNATIVES TO CONTROL CHARTS252
7-7 EVOLUTIONARY OPERATION253
7-8 OVERVIEW OF OTHER PROCEDURES260
7-9 EXERCISES265
8Process-Capability Analysis273
8-1 INTRODUCTION273
8-2 PROCESS-CAPABILITY ANALYSIS USING A HISTOGRAM OR A PROBABILITY PLOT275
8-2.1 Using the Histogram275
8-2.2 Probability Plotting280
8-3 PROCESS-CAPABILITY ANALYSIS USING A CONTROL CHART285
8-4 PROCESS-CAPABILITY ANALYSIS USING DESIGNED EXPERIMENTS288
8-5 SETTING SPECIFICATION LIMITS ON DISCRETE COMPONENTS293
8-5.1 Linear Combinations293
8-5.2 Nonlinear Combinations297
8-6 ESTIMATING THE NATURAL TOLERANCE LIMITS OF A PROCESS300
8-6.1 Tolerance Limits Based on the Normal Distribution300
8-6.2 Nonparametric Tolerance Limits301
8-7 EXERCISES302
9Economic Design of Control Charts307
9-1 INTRODUCTION307
9-1.1 Process Characteristics308
9-1.2 Cost Parameters309
9-1.3 Early Work and Semieconomic Designs310
9-2 ECONOMIC DESIGN OF THE -x CONTROL CHART312
9-2.1 Single Assignable-Cause Models312
9-2.2 Multiple Assignable-Cause Models324
9-2.3 Joint Economic Design of -x and R Control Charts332
9-3 ECONOMIC DESIGN OF THE CONTROL CHART FOR FRACTION NONCONFORMING333
9-4 ECONOMIC DESIGN OF OTHER CONTROL CHARTS336
9-5 SUMMARY338
APPENDIX 9AA COMPUTER PROGRAM FOR THE ECONOMIC DESIGN OF THE -x CONTROL CHART341
9-6 EXERCISES343
PART ⅢACCEPTANCE SAMPLING349
10Lot-By-Lot Acceptance sampling for Attrioutes351
10-1 THE ACCEPTANCE-SAMPLING PROBLEM351
10-1.1 Advantages and Disadvantages of Sampling353
10-1.2 Types of Sampling Plans354
10-1.3 Lot Formation354
10-1.4 Random Sampling355
10-1.5 Guidelines for Using Acceptance Sampling356
10-2 SINGLE-SAMPLING PLANS FOR ATTRIBUTES358
10-2.1 Definition of a Single-Sampling Plan358
10-2.2 The OC Curve359
10-2.3 Designing a Single-Samoping Plan With a Specified OC cirve366
10-2.4 Rectifying Inspection367
10-3 DOUBLE,MULTIPLE,AND SEQUENTIAL SAMPLING373
10-3.1 Double-Sampling Plans373
10-3.2 Meltiple-Sampling Plans382
10-3.3 Sequentral-Samping Plans383
10-4 A LOT-SENSITIVE COMPLIANCE(I TPD)SAMPLING PLAN387
10-5 MILITARY STANDARD 105D (ANSI/ASQC Z1.4)389
10-5.1 Description of the Standard389
10-5.2 Procedure392
10-5.3 Discussion408
10-6 DODGE-ROMIG SAMPLING PLANS413
10-6.1 LTPD Plans414
10-6.2 AOQL Plans420
10-6.3 Estimation of Process Average426
10-7 EXERCISES426
11Acceptance Sampling by Variables431
11-1 INTRODUCTION TO VARIABLES SAMPLING431
11-1.1 Advantages and Disadvantages of Variables Sampling431
11-1.2 Types of Sampling Plans Available432
11-1.3 Caution in the Use of Variables Sampling434
11-2 DESIGNING A VARIABLES SAMPLING PLAN WITH A SPECIFIED OC CURVE435
11-3 MIL STD 414 (ANSI/ASQC Z1.9)439
11-3.1 General Description of the Standard439
11-3.2 Use of the Tsblrs440
11-3.3 Discussion of MIL STD 414 and ANSI/ASQC Z1.9453
11-4 OTHER VARIABLES SAMPLING PROCEDURES455
11-4.1 Sampling by Variables to Give Assurance Regarding the Lot or Process Mean455
11-4.2 Sequential Sampling by Variables456
11-4.3 The Lot-Plot Method456
11-4.4 Narrow-Limit Gaging457
11-5 EXERCISES458
12 Other Acceptance-Sampling Procedures461
12-1 CHAIN SAMPLING461
12-2 CONTINUOUS SAMPLING463
12-2.1 CSP-1464
12-2.2 CSP-2,CSP-3,and Multilevel Plans468
12-2.3 MIL STD 1235B470
12-3 SKIP-LOT SAMPLING PLANS473
12-4 CONSIDERATION OF INSPECTION ERROR477
12-5 ECONOMIC DESIGN OF ACCEPTANCE-SAMPLING PLANS481
12-6 EXERCISES485
BIBLIOGRAPHY489
APPENDIX497
ⅠCumulative Poisson Distribution498
Ⅱ Cumulative Standard Normal Distribution501
Ⅲ Percentage Points of the x2Distribution503
Ⅳ Percentage Points of the r Distribution504
Ⅴ Percentage Points of the F Distribution505
Ⅵ Factors for Constructina variables Control Charts510
Ⅶ Factors for Two-Sided Normal Tolerance Limits511
Ⅷ Factors for One-Sided Normal Tolerance Limits512
Ⅸ Random Numbers513
Index515
《INTRODUCTION TO STATISTICAL QUALITY CONTROL》由于是年代较久的资料都绝版了,几乎不可能购买到实物。如果大家为了学习确实需要,可向博主求助其电子版PDF文件。对合法合规的求助,我会当即受理并将下载地址发送给你。
高度相关资料
-
- INTRODUCTION TO STATISTICAL REASONING
- MCGRAW HILL BOOK COMPANY INC
-
- STATISTICAL PROCESS CONTROL AND QUALITY IMPROVEMENT THIRD EDITION
- 1998 PRENTICE HALL
-
- INTRODUCTION TO STATISTICAL REASONING
- 1998 WCB MCGRAW-HILL
-
- Introduction to statistical quality control
- 1991 Wiley
-
- Introduction to Quantum Statistical Mechanics
- 1989 WORLD SCIENTIFIC WORLD PUBISHING CORP
-
- Frontiers in statistical quality control 3
- 1987 Physica-Verlag
-
- Frontiers in statistical quality control 2
- 1984 Physica-Verlag
-
- Statistical quality control methods
- 1976 M. Dekker
-

- The assurance sciences : an introduction to quality control and reliability
- 1978 Prentice-Hall
-

- Introduction to statistical inference
- 1987 SpringerVerlag
提示:百度云已更名为百度网盘(百度盘),天翼云盘、微盘下载地址……暂未提供。➥ PDF文字可复制化或转WORD
