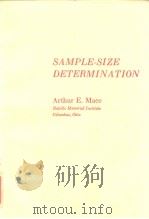
《SAMPLE-SIZE DETERMINATION》
| 作者 | ARTHUR E.MACE 编者 |
|---|---|
| 出版 | REINHOLD PUBLISHING CORPORATION |
| 参考页数 | 226 |
| 出版时间 | 1964(求助前请核对) 目录预览 |
| ISBN号 | 无 — 求助条款 |
| PDF编号 | 813428078(仅供预览,未存储实际文件) |
| 求助格式 | 扫描PDF(若分多册发行,每次仅能受理1册) |
1The Nature of Statistical Inference1
1.Inferences and Their Accuracy1
2.Some Definitions of Terms2
3.The Basis for Inferences3
4.Types of Inferences4
5.The Precision of Inferences4
2The Objective of a Sampling Experiment6
1.The Importance of Operational Definitions7
2.Defining the Observational Unit8
3.Defining the One or More Populations9
4.Defining the Population Parameter11
5.Defining the Type of Inference14
6.Defining the Precision in Inferences14
3The Variability Among Observations16
1.Procedure for Estimating Variability17
2.Designs for Reducing Variability17
3.Stratified Random Sampling18
4.Blocking Designs19
5.Estimating the Components of Sampling Error20
6.Estimating Variability Using a Double Sampling Procedure22
4The Power-Function Approach24
1.Estimation Problems25
2.Tests of Hypotheses27
3.Selection Problems29
4.Stating the Precision Desired in an Inference32
5Estimation Problems34
1.Confidence Interval for Normal Means35
2.Confidence Interval for Difference Between Two Nor-mal Means with Two Independent Samples from Populations with a Common Variance37
3.Confidence Interval for Difference Between Two Nor-mal Means with Two Independent Samples from Populations with Unequal Variances40
4.Confidence Interval for the Mean Difference Between Paired Observations from a Bivariate Normal Distri-bution43
5.Confidence Interval for Any One of Several Normal Means with Independent Samples from Populations with a Common Variance46
6.Confidence Interval for Difference Between Any Pair of Several Normal Means with Independent Samples from Populations with a Common Variance49
7.Confidence Interval for Any Contrast Among Several Normal Means with Independent Samples from Pop-ulations with a Common Variance52
8.Confidence Interval for Normal Variances56
9.Confidence Interval for the Ratio of Two Normal Variances58
10.Confidence Intervals for Binomial Proportions61
11.Confidence Interval for Exponential Scale Parameters63
12.Confidence Interval for the Ratio of Two Exponential Scale Parameters65
13.Upper Bound on Confidence Interval for Means When Variance is Known68
14.Tolerance Limits for the Percentile Range of a Variable69
15.Confidence Band for Cumulative Distribution Func-tions70
6Test of Hypotheses73
1.Tests of Hypotheses About Normal Means74
2.Tests of Hypotheses About Difference Between Two Normal Means with Two Independent Samples from Populations with a Common Variance77
3.Tests of Hypotheses About Difference Between Two Normal Means With Two Independent Samples from Populations with Unequal Variances81
4.Tests of Hypotheses About the Mean Difference Be-tween Paired Observations from a Bivariate Normal Distribution84
5.Tests of Hypotheses About the Equality of Several Normal Means with Independent Samples from Pop-ulations with a Common Variance88
6.Tests of Hypotheses About Normal Variances91
7.Tests of Hypotheses About the Ratio of Two Normal Variances94
8.Tests of Hypotheses About Binomial Proportions98
9.Tests of Hypotheses About the Equality of Two Bi-nomial Proportions101
10.Tests of Hypotheses About the Equality of Several Binomial Proportions104
11.Tests of Hypotheses About Exponential Scale Pa-rameters107
12.Tests of Hypotheses About the Ratio of Two Expo-nential Scale Parameters110
7Selection Problems114
1.Selecting the Best of Several Normal Means with Independent Samples from Populations with a Com-mon Variance115
2.Selecting the Best of Several Normal Variances119
3.Selecting the Best of Several Binomial Proportions122
4.Selecting the Best of Several Exponential Scale Pa-rameters126
8Sequential Sampling129
1.Sequential Tests of Hypotheses About Normal Means132
2.Sequential Tests of Hypotheses About Normal Vari-ances136
3.Sequential Tests of Hypotheses About Binomial Pro-portions140
4.Sequential Tests of Hypotheses About Exponential Scale Parameters143
9Lot Acceptance Sampling Plans147
1.Military Standard 105 C150
2.Military Standard 414156
10Sample-Size Precision Schedules163
1.Case Example:An Estimation Problem166
2.Case Example:A Test of Hypothesis167
3.Case Example:A Selection Problem171
11Decision-Function Approach174
1.Estimating a Mean with Losses Proportional to the Square of the Error in the Estimate177
2.Estimating a Normal Mean with Losses Proportional to the Absolute Value of the Error in the Estimate178
3.Selecting the Best of Several Normal Means with In-dependent Samples from Populations with a Com-mon Variance180
4.Selecting the Better of Two Binomial Proportions182
5.Testing a Hypothesis About a Normal Mean with Loss from Acceptance and Loss from Rejection Linear Functions of the True but Unknown Population Mean185
6.Testing a Hypothesis About a Binomial Proportion with Loss from Acceptance and Loss from Rejection Linear Functions of the True but Unknown Binomial Proportion187
References190
Appendix Tables193
TABLE 1.Upper Percentage Points of the t Distribution195
TABLE 2.Upper Percentage Points of the x2 Distribu-tion196
TABLE 3.Upper 10 Percentage Points of the F Distri-bution198
TABLE 4.Upper 5 Percentage Points of the F Distri-bution200
TABLE 5.Upper 1 Percentage Points of the F Distri-bution202
TABLE 6.Upper Percentage Points of the Noncentral t Distribution when the Probability of Erroneously Reject-ing the Test Hypothesis(α)Equals 0.05204
TABLE 7.Upper Percentage Points of the Noncentral t Distribution when the Probability of Erroneously Reject-ing the Test Hypothesis(α)Equals 0.01205
TABLE 8.Upper Percentage Points of the Noncentral x2 Distribution when the Probability of Erroneously Re-jecting the Test Hypothesis(α)Equals 0.05206
TABLE 9.Upper Percentage Points of the Noncentral x2 Distribution when the Probability of Erroneously Re-jecting the Test Hypothesis(α)Equals 0.01207
TABLE 10.Upper 20 Percentage Points of the Ф Func-tion when the Probability of Erroneously Rejecting the Test Hypothesis(α)Equals 0.05208
TABLE 11.Upper 20 Percentage Points of the Ф Func-tion when the Probability of Erroneously Rejecting the Test Hypothesis(α)Equals 0.01209
TABLE 12.Upper 30 Percentage Points of the Ф Func-tion when the Probability of Erroneously Rejecting the Test Hypothesis(α)Equals 0.05210
TABLE 13.Upper 30 Percentage Points of the Ф Func-tion when the Probability of Erroneously Rejecting the Test Hypothesis(α)Equals 0.01211
TABLE 14.Upper 5 Percentage Points of the Multi-variate t Distribution with Correlations Plus One Half212
TABLE 15.Upper 1 Percentage Points of the Multi-variate t Distribution with Correlations Plus One Half213
TABLE 16.Upper 10 Percentage Points of the Student-ized Range,(xn-x1)/s214
TABLE 17.Upper 5 Percentage Points of the Student-ized Range,(xn-x1)/s216
TABLE 18.Upper 1 Percentage Points of the Student-ized Range,(xn-x1)/s218
TABLE 19.Upper Percentage Points of d(n,the Maxi-mum Absolute Difference Between Sample and Popula-tion Cumulative Distributions220
TABLE 20.y=2 arcsin ?221
Index223
1964《SAMPLE-SIZE DETERMINATION》由于是年代较久的资料都绝版了,几乎不可能购买到实物。如果大家为了学习确实需要,可向博主求助其电子版PDF文件(由ARTHUR E.MACE 1964 REINHOLD PUBLISHING CORPORATION 出版的版本) 。对合法合规的求助,我会当即受理并将下载地址发送给你。
高度相关资料
-

- SIZE AND DEMOCRACY
- 1973
-
- Sample Pretreatment and Separation
- JOHN WILEY & SONS
-

- SEX DETERMINATION
- 1954 JOHN WILEY & SONS INC
-

- PARTICLE SIZE MEASUREMENT
- 1990 CHAPMAN AND HALL
-

- Aqueous size-exclusion chromatography
- 1988 Elsevier
-

- LIFE-SIZE
- 1992 HOUGHTON MIFFLIN COMPANY
-

- THE SAMPLE SURVEY:THEORY AND PRACTICE
- 1975 MCGRAW-HILL BOOK COMPANY
-

- FAMILY SIZE AND ACHIVEMENT
- 1989 UNIVERSITY OF CALIFORNIA PRESS
-

- Particle size analysis 1985
- 1987 John Wiley and Sons Ltd
-

- Particle size analysis 1981
- 1982 Wiley Heyden Ltd
提示:百度云已更名为百度网盘(百度盘),天翼云盘、微盘下载地址……暂未提供。➥ PDF文字可复制化或转WORD


