《Table 6 RMS between the mean of the qualified models in Example A》
 提示:宽带有限、当前游客访问压缩模式
本系列图表出处文件名:随高清版一同展现
《Iterative static modeling of channelized reservoirs using history-matched facies probability data and rejection of training image》
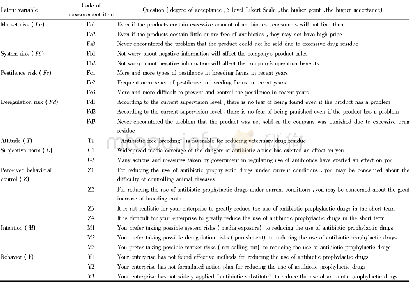
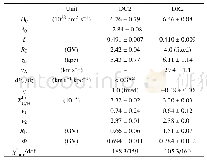
The three strategies for the proposed method,iterative static modeling with pseudo-soft data and TI rejection,give the results in Figs.9e–g and 10e–g.At first,Tables 6 and 7show the termination of the iteration for the three strategies.RMSPfvalue is steadily decreased for all strategies in Table 6.The RMSPfvalue at the first iteration from strategies 2 and 3 is higher than the value from strategy 1because the new models from the two strategies are quite different from the initial models.However,the value decreases sharply at the second iteration.The iteration of strategies 1 and 3 ends at the third iteration because RMSPf is less than 3.5,the convergence criterion.In the case of the strategy 2,it stops iterative static modeling at the second iteration,although it has RMSPfof 3.61,since TI has converged as shown in Table 7.
| 图表编号 | XD0042158100 严禁用于非法目的 |
|---|---|
| 绘制时间 | 2019.02.01 |
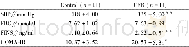
| 作者 | Kyungbook Lee、Sungil Kim、Jonggeun Choe、Baehyun Min、Hyun Suk Lee |
| 绘制单位 | Petroleum and Marine Research Division, Korea Institute of Geoscience and Mineral Resources、Department of Climate and Energy Systems Engineering,Division of Sustainable Systems Engineering, Ewha Womans University、Department of Energy Systems Engineering, |
| 更多格式 | 高清、无水印(增值服务) |