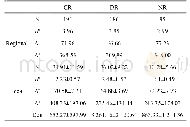
《Table 1 Descriptive summary of taxa richness (S) , ShannonWiener index (H′) , average taxonomic dis
 提示:宽带有限、当前游客访问压缩模式
本系列图表出处文件名:随高清版一同展现
《Responses of diff erent biodiversity indices to subsampling efforts in lotic macroinvertebrate assemblages》
At regional scale,191(belonging to 8 classes,17orders and 69 families),186(9,16 and 69)and 95taxa(4,6 and 38)were collected in CR,DR and NR,respectively.Aquatic insects were all the dominant taxa across the three rivers.CR had the highest regional Shannon-Wiener diversity,followed by DR and NR.For TD indices,Λ+was highest in CR compared with the other two rivers,whereasΔ+was highest in NR,followed by CR and DR(Table 1).
| 图表编号 | XD0034430500 严禁用于非法目的 |
|---|---|
| 绘制时间 | 2019.01.01 |
| 作者 | WANG Jun、LI Zhengfei、SONG Zhuoyan、ZHANG Yun、JIANG Xiaoming、XIE Zhicai |
| 绘制单位 | CAS Key Laboratory of Freshwater Ecology and Biotechnology, Institute of Hydrobiology, Chinese Academy of Sciences、University of Chinese Academy of Sciences、CAS Key Laboratory of Freshwater Ecology and Biotechnology, Institute of Hydrobiology, Chinese Aca |
| 更多格式 | 高清、无水印(增值服务) |
查看“Table 1 Descriptive summary of taxa richness (S) , ShannonWiener index (H′) , average taxonomic distinctness (Δ+) , and”的人还看了
-

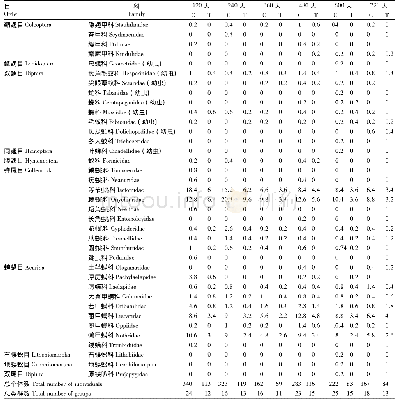
- Table 1 Individual densities and species richness of soil fauna during litter decomposition of bamboo(Fargesia spathacea
-

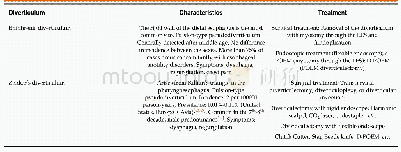
- Table 1 Metadata summary of“Monthly NPP 1 km raster dataset of China’s terrestrial ecosystems(1985–2015)”


