《Table 1 Research data used in this study》
 提示:宽带有限、当前游客访问压缩模式
本系列图表出处文件名:随高清版一同展现
《Evaluating and modeling the spatiotemporal pattern of regional-scale salinized land expansion in highly sensitive shoreline landscape of southeastern Iran》
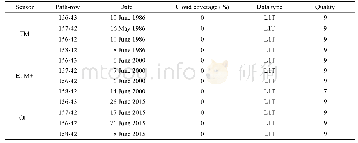
Landsat imagery was used as the primary source of data to delineate salt land expansion in a 30-a time profile.It should be noted that the salinization process in this research was referred to any kind of processes which cause the accumulation of soluble salt in surface soils(Hanin et al.,2016).Such a definition includes visual and spectral changes which were detectable by satellite sensors and the users.Due to availability of ancillary data such as GPS-field collected reference points and historical LULC maps as well as the magnitude of salt land expansion in the study area,Landsat imagery data was selected to explore salinized lands for the years 1986(TM sensor),2000(ETM+sensor),and 2015(OLI sensor).Moreover,in each year,four Landsat images with path and row of 158-42,157-42,156-42,and 156-43 were acquired to cover the whole extent of the study area(12 tiles in total).Table 1 provided the main characteristics of the Landsat images processed in this research.Furthermore,a 30-m spacing digital topographic model(DEM)map and detailed digital maps of coastline and sea water channel networks from the national project of Makran region development(Moradi,2016)were employed to produce the sensitivity of land to salinization and also to calibrate the LULC change model.
| 图表编号 | XD0020365800 严禁用于非法目的 |
|---|---|
| 绘制时间 | 2018.12.01 |
| 作者 | Mohammad SHAFIEZADEH、Hossein MORADI、Sima FAKHERAN |
| 绘制单位 | Department of Natural Resources, Isfahan University of Technology、Department of Natural Resources, Isfahan University of Technology、Department of Natural Resources, Isfahan University of Technology |
| 更多格式 | 高清、无水印(增值服务) |