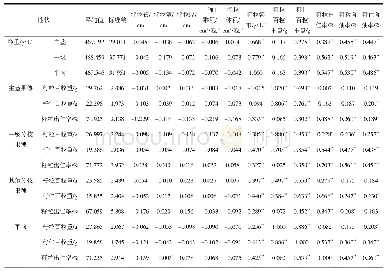
《Tab.2 Correlation analysis of meat quality during different shelf life》
 提示:宽带有限、当前游客访问压缩模式
本系列图表出处文件名:随高清版一同展现
《Changes in Chilled Chicken Quality and Correlation Analysis during Different Shelf Life》
Note:*indicates significant difference at 0.05 level(both sides);**indicates extremely significant difference at 0.01 level(both sides).
As shown in Tab.2,the p H of chilled chicken had significant positive correlation with water loss rate during different shelf life(P<0.05),and the correlation coefficient was 0.902.The p H had extremely significant negative correlation with shear force(P<0.01),and the correlation coefficient was-0.92.The p H was negatively correlated with L*,a*,b*(P>0.05);the water loss rate was negatively correlated with shear force,L*,a*(P>0.05),and positively correlated with b*(P>0.05);the shear force was positively correlated with L*,a*,b*(P>0.05);L*was positively correlated with a*,b*(P>0.05);a*was positively correlated with b*(P>0.05);the shear force and a*was negatively correlated with inosinic acid;the water loss rate,L*and b*were positively correlated with inosinic acid(P>0.05).
| 图表编号 | XD00183476400 严禁用于非法目的 |
|---|---|
| 绘制时间 | 2018.04.01 |
| 作者 | Ju Xiaojun、Tu Yunjie、Zou Jianmin、Zhang Ming、Ji Gaige、Shan Yanju、Liu Yifan、Shu Jingting |
| 绘制单位 | Jiangsu Institute of Poultry Science,Jiangsu Key Laboratory of Poultry Genetic Breeding、Jiangsu Institute of Poultry Science,Jiangsu Key Laboratory of Poultry Genetic Breeding、Jiangsu Institute of Poultry Science,Jiangsu Key Laboratory of Poultry Genetic |
| 更多格式 | 高清、无水印(增值服务) |
查看“Tab.2 Correlation analysis of meat quality during different shelf life”的人还看了
-

- Table 6 Correlation analysis of relative salt damage index and different growth indicators of soybean under different sa


