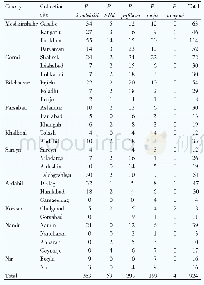
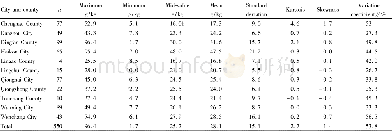
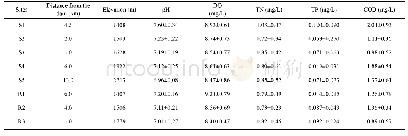
《Table 2 HTP and KP valued in the study area》
 提示:宽带有限、当前游客访问压缩模式
本系列图表出处文件名:随高清版一同展现
《"Evaluation of a traditional method for peak flow discharge estimation for floods in the Wenchuan Earthquake area,Sichuan Province,China"》
Notes:P=rainfall probability;HTP=design rainfall amount in different duration periods(1/6,1,6,or 24 h),a statistic product from the long-term historical precipitation data(mm);Kp=modulus coefficient,which is a lookup value from the relation betwee
(2) Flow discharge monitoring stations.Three flow discharge stations were established in the W-I and W-II tributaries(stations S1 and S2),and in the main stream(station S3).The geomorphic parameters for the three basins are listed in Table 1.Flow depth(h)and surface velocity(v)were monitored using ultrasonic stage meters and electromagnetic Doppler speedometers.Video cameras were also deployed to calibrate the instruments.The discharge volume was calculated as the product of the cross-sectional water velocity(v/)and cross-sectional area of the flow(A):Q=v/A.Here we use the relationship of v/=0.6v,which was derived by Takahashi from the Bagnold’s dilatant fluid theory,and tested by experiments and field data(Takahashi 1991;Hungr et al.1984).
| 图表编号 | XD0056566800 严禁用于非法目的 |
|---|---|
| 绘制时间 | 2019.03.01 |
| 作者 | GUO Xiao-jun、CUI Peng、LI Yong、LIU Jin-feng、GE Yong-gang、WANG Ci-de |
| 绘制单位 | Key Laboratory of Mountain Surface Process and Hazards、Institute of Mountain Hazards and Environment,Chinese Academy of Sciences、Center for Excellence in Tibetan Plateau Earth Sciences,Chinese Academy of Sciences、Key Laboratory of Mountain Surface Process |
| 更多格式 | 高清、无水印(增值服务) |


