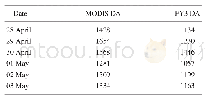
《Table 2.Number of satellite observations in the MODIS DA and FY3 DA experiments.》
 提示:宽带有限、当前游客访问压缩模式
本系列图表出处文件名:随高清版一同展现
《Aerosol Data Assimilation Using Data from Fengyun-3A and MODIS:Application to a Dust Storm over East Asia in 2011》
To examine the impacts of AOD DA on the aerosol analysis,we plotted the bias(Figs.4a–c)and root-mean-square error(RMSE)(Figs.4d–f) of the simulated AOD when using the FY-3 and MODIS observation data as reference data.The DA experiments were performed at 0600 UTC,when both the FY-3 and the MODISAOD data were present,from 28 April to 3 May 2011.As shown in Fig.4 and Table 1,it is clear that the model underpredicted AOD(biases of-0.3 to-0.7).After DA,the model low bias was substantially reduced,with bias(RMSE)values consistently near-0.1(0.2)in FY3 DA,while bias(RMSE)values were consistently near-0.2(0.2)in MODIS DA and 0.1(0.1)in FY3+MODIS DA.Overall,the bias and RMSE were reduced by an average of 30%compared to the CNT experiment during the dust storm period,which verified the positive effects of AOD DA systems.In addition,assimilation using different satellite data showed different effects:the bias and RMSE values calculated based on the FY3 DA experiment were reduced more than the values from the MODIS DA experiment.Furthermore,in the FY3+MODIS DA experiment,the bias and RMSE values were reduced more than the two individual data systems.
| 图表编号 | XD0030263700 严禁用于非法目的 |
|---|---|
| 绘制时间 | 2019.01.10 |
| 作者 | Xiaoli XIA、Jinzhong MIN、Feifei SHEN、Yuanbing WANG、Chun YANG |
| 绘制单位 | Key Laboratory of Meteorological Disaster of Ministry of Education (KLME)、Joint International Research Laboratory of Climate and Environment Change (ILCEC)、Collaborative Innovation Center on Forecast and Evaluation of Meteorological Disasters,Nanjing Univ |
| 更多格式 | 高清、无水印(增值服务) |
查看“Table 2.Number of satellite observations in the MODIS DA and FY3 DA experiments.”的人还看了
-

- Table 2.Ratios between observed and simulated crop yields under different ranges of the Standardized Precipitation Evapo
-

- Table 1.comparisons between the satellite-derived and in situ-measured netsr F, as well as each flux component, includin
-

- Table 2 Number of samples for each soil type correctly classified in the conventional soil map and in soil maps updated


