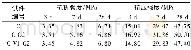
《Table 1Structural properties of mesoporous C and the various catalysts used for ammonia synthesis.》
 提示:宽带有限、当前游客访问压缩模式
本系列图表出处文件名:随高清版一同展现
《以RuCl_3/SiO_2为模板制备高性能镶嵌式钌基氨合成催化剂(英文)》
*Calculated from the desorption branch of the isotherm according to the BJH method.
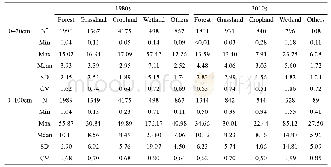
The structure of the obtained MC and Ru‐MC was charac‐terized by Raman spectroscopy.The Raman spectra of the MC,Ru‐MC,Ru/MC,and AC are given in Fig.2.Two bands at 1347and 1590 cm?1 were observed.The band at 1347 cm?1 is re‐ferred to as the D band and is attributed to the vibrations of C atoms with dangling bonds in the planar terminations of a dis‐ordered graphite‐like structure.The band around 1590 cm?1 is referred to as the G band,which corresponds to the E2g vibra‐tions(aromatic C=C;sp2 C)[25].The intensity ratio ID/IG re‐flects the degree of graphitization,with a decrease in its value suggesting that the degree of graphitization has increased.The ID/IG values(Table 1)of all the samples are almost the same,ca.0.83–0.84.This value is typical of C materials with an amor‐phous framework.On the other hand,the ID/IG values of Ba‐Ru‐K/MC and Ba‐K/Ru‐MC are increased to about 0.89 and0.86,respectively,which could be caused by the activation of the C support during the reduction of the catalysts after loading Ba(NO3)2 and KNO3 to the as‐prepared MC and Ru‐MC[31].The ID/IG value of MC is lower than that of AC,which is 0.89,indi‐cating that the degree of graphitization of MC is higher than that of AC.Moreover,the emergence of the G′‐band around2880 cm–1 indicates the formation of a‐few‐layers structured graphitic C[26,27].This band is more obvious for the MC and Ru‐MC samples than for AC.This result may indicate that the MC and Ru‐MC synthesized via sucrose contain a‐few‐layers structured graphitic C.The pore and framework structures of MC and Ru‐MC were characterized via HRTEM,and the results are given in Fig.3.As discussed above,the pore structures of MC,Ru‐MC,and Ru/MC are similar.The typical TEM and HRTEM images of MC are given in Fig.3(a)and Fig.3(b),re‐spectively.It can be observed that the mesopores are disor‐dered,with pore sizes in the range 10–20 nm,and the C wall is quite thin compared with that of AC(Fig.3a).A few layers of the graphitic structure can also be observed in the HRTEM im‐age.
| 图表编号 | XD0028864600 严禁用于非法目的 |
|---|---|
| 绘制时间 | 2019.01.01 |
| 作者 | 周亚萍、马永承、蓝国钧、唐浩东、韩文锋、刘化章、李瑛 |
| 绘制单位 | 浙江工业大学工业催化研究所、四川省华地建设工程有限责任公司、浙江工业大学工业催化研究所、浙江工业大学工业催化研究所、浙江工业大学工业催化研究所、浙江工业大学工业催化研究所、浙江工业大学工业催化研究所、浙江工业大学工业催化研究所 |
| 更多格式 | 高清、无水印(增值服务) |


