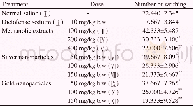
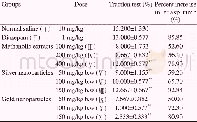
《Table 7 Results of methanol extraction》
 提示:宽带有限、当前游客访问压缩模式
本系列图表出处文件名:随高清版一同展现
《Extraction Process and Content Determination of Total Flavonoids in Ginkgo( Ginkgo biloba L. ) Leaves》
Standard curve y=0.034 4x+0.020 1,R2=0.999 9;percentage content(%)=C×10×50/m×100%,wherein C is the concentration,m is the weight of ginkgo leaves.
Since the orthogonal test used ethanol as the solvent to study the optimal extraction conditions in the ethanol extraction method,the ethanol extraction rate and methanol extraction rate were compared to determine the optimal extraction scheme.The ethanol extraction results are shown in Table 6,and the methanol extraction results are shown in Table 7.To compare which of the ethanol extraction method and the methanol extraction method was better,the results were statistically tested.When comparing these two methods,whether the two population variances were the same should be determined at first,that is,the homogeneity of the variance,and F test was required.If the two population variances are equal,t test is used directly.If not,t test or variable transformation or rank sum test might be used.The results of the F test are shown in Table 8.
| 图表编号 | XD0028004800 严禁用于非法目的 |
|---|---|
| 绘制时间 | 2019.02.01 |
| 作者 | Dengfeng ZOU、Hua ZHU、Binghua QIN、Xiaohua WANG |
| 绘制单位 | Guilin Medical University、Guilin Medical University、Guilin Medical University、Guilin Medical University |
| 更多格式 | 高清、无水印(增值服务) |


