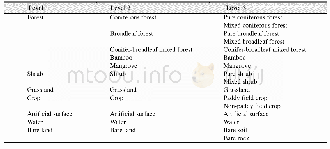
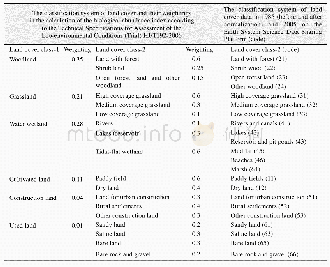
《Table 2 Land cover types and weightings in the calculation of biological abundance and their relati
where Abi ois the normalized difference index of the biological abundance and Amax is the maximum value of the biological abundance index before the normalization process.The weight distribution of each land cover type is shown in Table 2.
| 图表编号 | XD0027611500 严禁用于非法目的 |
|---|---|
| 绘制时间 | 2017.03.25 |
| 作者 | 郭春霞、诸云强、孙伟、宋佳 |
| 绘制单位 | 国家环境保护部信息中心、中国科学院地理科学与资源研究所资源与环境信息系统国家重点实验室、江苏省地理信息资源开发与利用协同创新中心、白洋淀流域生态保护与京津冀可持续发展协同创新中心、中国农业科学院农业信息研究所、中国科学院地理科学与资源研究所资源与环境信息系统国家重点实验室、江苏省地理信息资源开发与利用协同创新中心、白洋淀流域生态保护与京津冀可持续发展协同创新中心 |
| 更多格式 | 高清、无水印(增值服务) |
 提示:宽带有限、当前游客访问压缩模式

