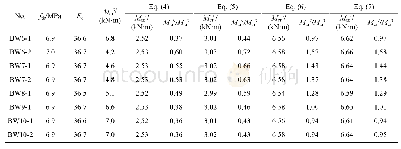
《Table 4–Calculated value of temperature correction factorθ.》
 提示:宽带有限、当前游客访问压缩模式
本系列图表出处文件名:随高清版一同展现
《Tuning of activated sludge in winter based on respirogram profiles under standard and site temperatures》
A temperature was chosen as the critical temperature,the measured data were divided into two parts,above and below this temperature,respectively,and the two data sets were fitted.Then the temperature with the highest R2value was chosen as the critical temperature by trying different temperatures.The critical temperature for the Arrhenius equation temperature correction factorθwas calculated as 8°C in this study.The values ofθobtained through least squares fitting for OURn,OURcand OURencwere 1.08,1.04 and 1.04 for temperatures above 8°C,and 1.51,1.16 and 1.16 for temperatures below 8°C,respectively(Table 4),which was within the range of reported values(Table 1).The OUR20x,calin Eq.(2)under low temperatures was much higher than that under high temperatures,especially for nitrifiers(Table 4).Using the fitted value ofθ,the predicted OUR20x,calwas calculated for theoretical analysis,although it was not applicable under lower temperatures because the temperature 20°C was out of the range of lower temperatures(the maximum value was the critical temperature).During the periods P3–P4,the measured values of OURx20were higher than the predicted values of OUR20x,cal.In contrast,during period P5 and the early stage of period P2 the calculated values were higher(Fig.4).It is reasonable that the measured values were lower than the predicted values,as some of the bacteria either could not recover in a short time or simply died when the temperature changed so rapidly.It should be noted that the predicted values OUR20x,calincreased suddenly at the beginning of period P5 when the temperature dropped below the critical value of 8°C,suggesting that a lower fraction of biomass could recover if temperature increased back to normal,which also occurred in the early stage of period P2 when the temperature started to decrease.A smaller fraction of biomass was recoverable under the critical temperature,possibly due to its larger fraction of live biomass,as it has been reported that the live fraction at temperatures of 20 and 1°C was approximately 71%and 83%,respectively(Young et al.,2017).The increase of measured OURx20at lower temperature lacks intuitive explanation,though it is a common phenomenon also reported by other researchers(Hoang et al.,2014a;Hoang et al.,2014b).For example,an approximately 20%increase of activity was observed when the temperature decreased from20 to 1°C(Hoang et al.,2014b).Such increase may be ascribed to the fact that more of the live fraction of biomass was stimulated from the dormancy status under a lower temperature(Young et al.,2017).It seems that the increased live fraction of biomass(the pink shadowed area in Fig.4)survived in the system until the temperature decreased to the critical temperature.Similar results of increased live fraction were also found using the reported data with a similar calculation by Eq.(3).A significant increase of R20calalways occurred in the initial period when the temperature started to decrease(Fig.5).Deterioration caused by sudden or frequent increase or decrease of temperature,or by long-time duration under a low temperature,resulted in an increase of R20cal(Fig.5).As OUR20x,calchanged in the same way as R20cal,an increase in the predicted values of respirogram OUR20x,calsuggests an increase in the live fraction of biomass;however,a sudden increase is an alarm signal for the unrecoverable deterioration of biomass.
| 图表编号 | XD0052063400 严禁用于非法目的 |
|---|---|
| 绘制时间 | 2019.05.15 |
| 作者 | Zhihua Li、Zhenyu Hang、Qian Zhang、Shuangshuang Zhang、Tianyu Zhang、Hanqing Yu |
| 绘制单位 | School of Environmental and Municipal Engineering, Xi'an University of Architecture and Technology、School of Environmental and Municipal Engineering, Xi'an University of Architecture and Technology、School of Environmental and Municipal Engineering, Xi' |
| 更多格式 | 高清、无水印(增值服务) |


