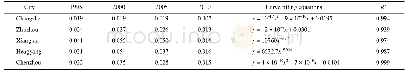
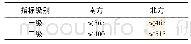
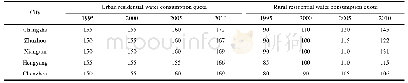
《Table 3 Water consumption per unit of industrial output value in the administrative units of water
 提示:宽带有限、当前游客访问压缩模式
本系列图表出处文件名:随高清版一同展现
《"Ecosystem Service Flow Insights into Horizontal Ecological Compensation Standards for Water Resource: A Case Study in Dongjiang Lake Basin, China"》
Notes:In the curve fitting equation,x represents the annual total industrial output value of the city(unit:103 yuan RMB)which is derived from the Hunan Statisti-cal Yearbook(2007–2013),and y represents the water consumption per unit of industrial ou
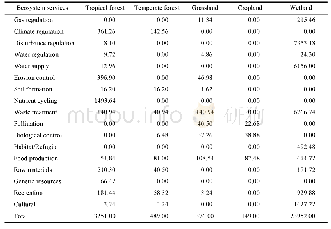
where AGji,ANji,Iji,and Hji are volumes of water associated with agricultural irrigation,animal raising,industrial,and residential consumption,respectively,on pixel i for land cover type j.Nmji represents the area of crop type m on pixel i for land cover type j.WNmji indicates the irrigation amount per unit area for the same crop type m on pixel i for land cover type j(Table 1),which was calculated using the crop water(CROPWAT)model of the FAO(http://www.fao.org/land-water/databasesand-software/cropwat/en/).Dmji is the amount of product or number of animal type m on pixel i for land cover type j.WDmji is the virtual water content for the same type of animal or animal product(Hoekstra,2009)(Table 2) .Gji is the total industrial output value on pixel i for land cover type j.WGji is the water consumption per unit of industrial output value based on the curve fitting of data from the Water Resources Communiquéof Hunan Province(2007–2013;Table 3).PCji and PRji represent the urban and rural populations,respectively,on pixel i for land cover type j.WPCji and WPRji are the urban and rural residential water consumption quotas,respectively,on pixel i for land cover type j based on the local standard DB43/T 388–2014 of Hunan Province(Table 4).
| 图表编号 | XD0046960800 严禁用于非法目的 |
|---|---|
| 绘制时间 | 2019.04.01 |
| 作者 | XU Jie、XIAO Yu、XIE Gaodi、JIANG Yuan |
| 绘制单位 | Institute of Geographic Sciences and Natural Resources Research, Chinese Academy of Sciences、College of Resources and Environment, University of the Chinese Academy of Sciences、Institute of Geographic Sciences and Natural Resources Research, Chinese Acade |
| 更多格式 | 高清、无水印(增值服务) |