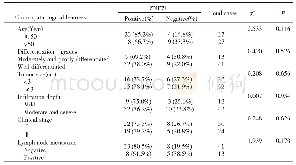
《Table 2 Regional correlations and signifi cance levels between the winter mean SIC and SST fi elds
 提示:宽带有限、当前游客访问压缩模式
本系列图表出处文件名:随高清版一同展现
《Satellite-observed trends in the Arctic sea ice concentration for the period 1979–2016》
Regionally,the areas with higher correlations obtained between the winter average SST and SIC fi elds in the ice-covered areas for the period 1982–2016(Table 2)are mainly located around the marginal shelf seas,e.g.,the Kara Sea(-0.84),Barents Sea(-0.92),and Bering Sea(-0.93)wherein the removal of sea ice cover contributes to a warmer surface airfl ow.In the Central Arctic Ocean,the two variables also correlate well(R=-0.76).The signifi cant SIC decrease over the Central Arctic Ocean,especially for the summer and autumn,contributes to a local increase in the SST.All these correlations past the99%signifi cance test.According to the Fig.9,the enervate increasing SIC trend occured in the Beaufort Sea(0.65%/dec),East Siberian Sea(0.32%/dec).On the contrary,the ice in Kara Sea and Greenland Sea retreated rapidly,and the fastest decreasing SIC trend-9.67%/dec is in the Barents Sea,which is more than seven times the velocity of that in the whole Arctic ice-covered areas.
| 图表编号 | XD0034428600 严禁用于非法目的 |
|---|---|
| 绘制时间 | 2019.01.01 |
| 作者 | WANG Yunhe、BI Haibo、HUANG Haijun、LIU Yanxia、LIU Yilin、LIANG Xi、FU Min、ZHANG Zehua |
| 绘制单位 | CAS Key Laboratory of Marine Geology and Environment, Institute of Oceanology, Chinese Academy of Sciences、University of Chinese Academy of Sciences、CAS Key Laboratory of Marine Geology and Environment, Institute of Oceanology, Chinese Academy of Sciences |
| 更多格式 | 高清、无水印(增值服务) |
查看“Table 2 Regional correlations and signifi cance levels between the winter mean SIC and SST fi elds in the ice-covered su”的人还看了
-

- Table 1.Correlation between expression of ZNF711 and clinicopathological features in cervical cancer
-

- Table 3 Correlations between brain-derived neurotrophic factor level and clinical and experimental parameters in all sub


