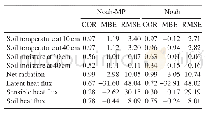
《Table 4.As in Table 2 but for Daxing station.》
 提示:宽带有限、当前游客访问压缩模式
本系列图表出处文件名:随高清版一同展现
《Subdaily to Seasonal Change of Surface Energy and Water Flux of the Haihe River Basin in China: Noah and Noah-MP Assessment》
Notes:all correlation coefficients passed the 95%confidence test.The MBE and RMSE are inC.
The simulated daily soil temperature and moisture at the depths of 10 and 40 cm at Daxing station were validated against observations(Fig.8).Generally,the LSMs appropriately capture the seasonal variations of the soil temperatures,with correlation coefficients ranging from 0.96 to 0.97(Table 4).However,the simulated soil temperature magnitudes are much larger than the observed data(with RMSE ranging from 2.71?C to 3.40?C).The offline simulations always present higher(lower)soil temperatures in summer(winter)than the observations.This phenomenon is even distinct in the deeper soil layer.It is important to note that Noah-MP shows some improved skill in the summer soil temperature simulations,while the winter soil temperature simulations are comparable with Noah(Fig.8b).
| 图表编号 | XD0030265000 严禁用于非法目的 |
|---|---|
| 绘制时间 | 2019.01.10 |
| 作者 | Fuqiang YANG、Li DAN、Jing PENG、Xiujing YANG、Yueyue LI、Dongdong GAO |
| 绘制单位 | Key Laboratory of Regional Climate-Environment for Temperate East Asia,Institute of Atmospheric Physics,Chinese Academy of Sciences、University of Chinese Academy of Sciences、Key Laboratory of Regional Climate-Environment for Temperate East Asia,Institute |
| 更多格式 | 高清、无水印(增值服务) |


