《表5 2005—2014年用电量预测结果分析Table 5 Predication results analysis of power consumption in 2005—2014》
 提示:宽带有限、当前游客访问压缩模式
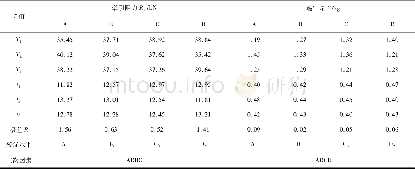
将实际测得数据与预测数据进行对比,其结果如表5所列。
| 图表编号 | XD0021422800 严禁用于非法目的 |
|---|---|
| 绘制时间 | 2018.04.25 |
| 作者 | 任芳玲、李文波、贺甜 |
| 绘制单位 | 延安大学数学与计算机科学学院、延安大学数学与计算机科学学院、延安大学数学与计算机科学学院 |
| 更多格式 | 高清、无水印(增值服务) |
将实际测得数据与预测数据进行对比,其结果如表5所列。
| 图表编号 | XD0021422800 严禁用于非法目的 |
|---|---|
| 绘制时间 | 2018.04.25 |
| 作者 | 任芳玲、李文波、贺甜 |
| 绘制单位 | 延安大学数学与计算机科学学院、延安大学数学与计算机科学学院、延安大学数学与计算机科学学院 |
| 更多格式 | 高清、无水印(增值服务) |

