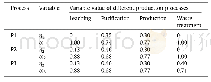
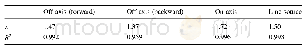
《Table 2Experimental results for the recirculation ratio and correlation factors of different APT pr
 提示:宽带有限、当前游客访问压缩模式
本系列图表出处文件名:随高清版一同展现
《基于高效清洁生产的全过程污染控制(WPPC)——中国钨行业典型案例研究》
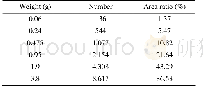
As shown in Fig.7,the environmental impact indicator decreased slightly when ion-exchange technology was implemented into the APT production to replace the salt roastingsolvent extraction process.However,large amounts of wastewater are still generated,especially in the process of resin/membrane regeneration,although waste gas is significantly reduced in comparison with P1 and P2.In the case of P3,in which WPPC principles were introduced for process optimization,the environmental impact indicator greatly decreased(Fig.7),indicating the importance of inter-circulation and optimization of the flow of materials and energy throughout the whole process.The environmental impact aligns with the cost-effectiveness factor for waste treatment,and it is important to identify the amount of waste material generation during a specific process.In WPPC optimization,it is critical to consider both the environmental impact reduction and the operational cost reduction in order to account for the full decrease in the comprehensive cost of the whole process.Figs.6and 7 suggest that WPPC is an effective methodology for the process optimization of a typical hydrometallurgical process.The model developed in this research can be used to evaluate the effectiveness of such a process.
| 图表编号 | XD001946900 严禁用于非法目的 |
|---|---|
| 绘制时间 | 2019.08.01 |
| 作者 | 曹宏斌、赵赫、张笛、刘晨明、林晓、李玉平、宁朋歌、孙家君、张懿、孙峙 |
| 绘制单位 | Beijing Engineering Research Center of Process Pollution Control and National Engineering Laboratory for Hydrometallurgical Cleaner Production Technology, Division of Environment Technology and Engineering, Institute of Process Engineering, Chinese Academ |
| 更多格式 | 高清、无水印(增值服务) |
