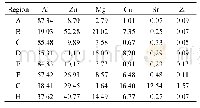
《Table 2 Composition of the“Dataset of cultural diversity in Southwest China(1990,2000,2010)”》
 提示:宽带有限、当前游客访问压缩模式
本系列图表出处文件名:随高清版一同展现
《"中国西南地区十年尺度文化多样性指数数据集(1990,2000,2010)"》
The province-level units with low CD values were distributed in the northern part of the study area,whereas the units with high CD were located in the southern part(Figure 2).Among the province-level units,none had CD values lower than 0.2,while a high proportion had CD values greater than 0.9,indicating a generally high level of cultural diversity at the province level in Southwest China.Thus,on the province scale,ethnic groups in Southwest China tended to be blended.
| 图表编号 | XD00110316600 严禁用于非法目的 |
|---|---|
| 绘制时间 | 2019.06.25 |
| 作者 | 沈园、邓红兵、沈明星 |
| 绘制单位 | 苏州市农业科学院(江苏太湖地区农业科学研究所)、中国科学院生态环境研究中心城市与区域生态国家重点实验室、苏州市农业科学院(江苏太湖地区农业科学研究所) |
| 更多格式 | 高清、无水印(增值服务) |


